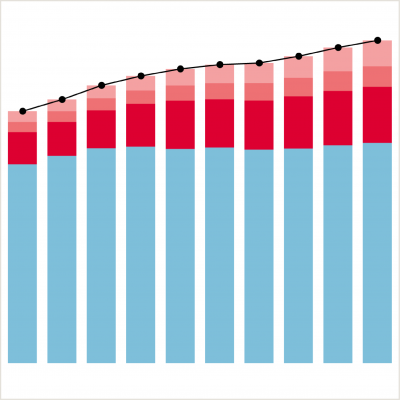
Trends in the number of English NHS hospital admissions, 2006 to 2016
27 February 2018

- More people than ever before are being admitted to hospital in the English NHS.
- Since 2006, the total annual number of hospital admissions has increased by 28.1%, from over 11 million admissions in 2006/07 to over 14 million admissions in 2015/16.
- Those that are admitted are older, and a greater proportion is now admitted with a record of multiple long-term conditions than in 2006.
The NHS is experiencing a period of unprecedented pressures on resources. In this chart of the month we depict how the number of in-patient admissions to hospital in the English NHS, and the patient mix, have changed over a ten-year period.
Since 2006/07, the total number of hospital admissions across all English hospitals increased by 28.1%, reaching over 14 million in 2015/16. The number of admitted patients aged above 65 years increased by 46%, from 4 million in 2005/06 to just under 6 million in 2015/16. We examined whether patients had any of 22 long-term conditions, associated with patient complexity. The number of patients admitted with at least one of these long term conditions recorded doubled, now standing at over 4.5 million.
The number of admissions presented in this chart was extracted from the Hospital Episode Statistics database, an administrative health dataset containing unidentifiable patient information for all patients treated in NHS hospitals. For each patient, we constructed linked health records from the day of admission to discharge, and counted one admission even when the patient changed the hospital as part of their stay.
We included only patients aged 18 and above with complete age records and used the Charlson comorbidity index to count long term health conditions. The Charlson index represents a patient’s likelihood of dying within one year and was calculated using a list of recorded diagnosis codes of long term conditions (eg heart failure, cancer, and diabetes) and accounts for any of the codes recorded within one year prior to the admission. While the Charlson index is a commonly used indicator of patient complexity, it only captures 22 conditions and therefore might not be fully representative of a patient’s true complexity. It is also likely that coding practices for certain diagnosis codes has greatly improved over the years. So the increasing complexity, could also be due to better recording of data.
Work with us
We look for talented and passionate individuals as everyone at the Health Foundation has an important role to play.
View current vacanciesThe Q community
Q is an initiative connecting people with improvement expertise across the UK.
Find out more

