Local healthy life expectancy at birth by region and sex
6 January 2022
Key points
-
In the North East, every local authority healthy life expectancy estimate is below UK average for men (62.9 years) and women (63.3 years). Within the region, male life expectancy at birth is highest in Newcastle (61.0 years), while the highest for females is in Darlington (62.1 years).
-
Scotland has the highest within region inequality in healthy life expectancy at birth for men, at 15.2 years, and women, at 18.7 years. In contrast, the North East (where healthy life expectancy is lower in general) has the lowest for men, at 4.0 years, and women, at 5.3 years.
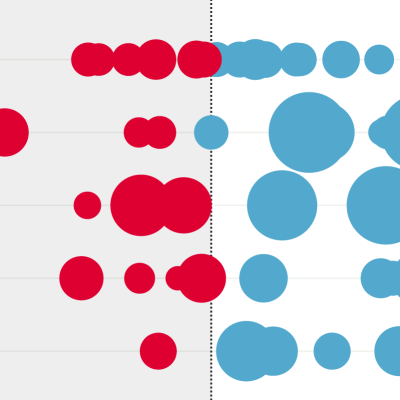
This chart shows healthy life expectancy at birth, in years, for each local authority in the UK. Healthy life expectancy measures the number of years an individual is expected to live in good health, based on period life expectancy and a measure of self-rated health. The size of the bubble reflects the size of the population in that area, with larger bubbles reflecting larger populations.
-
In the East Midlands, North West, and Yorkshire and The Humber at least two-thirds of local authorities in the region have female local authority healthy life expectancy estimates below the UK average. In the North East, female healthy life expectancy at birth is lower than the UK average (63.3 years) in every local authority, ranging from the highest in Darlington (62.1 years) to Stockton on Tees (56.8 years).
-
In Yorkshire and The Humber four-fifths of local authorities in the region had male local authority healthy life expectancy estimates below the UK average. In the North East, male healthy life expectancy is lower than the UK average (62.9 years) in every local authority, ranging from the highest in Newcastle (61.0 years) to the lowest in Hartlepool (57.0 years).
-
As healthy life expectancy is lower in general in the North East, it has the lowest within region inequality in healthy life expectancy at birth for men, at 4.0 years, and women, at 5.3 years.
-
Scotland has the highest within region inequality in healthy life expectancy at birth. For women in Scotland, the difference between the highest and lowest local authority estimates of healthy life expectancy at birth is 18.7 years, ranging from 56.3 years in North Ayrshire to 75.0 years in the Orkney Islands. For men, the difference is 15.2 years, ranging from 54.6 years in Glasgow City to 69.8 in East Dunbartonshire.
There is a wide range in healthy life expectancy at birth at local authority level, highlighting the health inequality that exists within the UK and within regions of the UK. The UK government has acknowledged the need to ‘level up health’ and the importance of health to economic prosperity. There is a need for a whole government strategy to improve health and health equity, with a focus on the wider factors – beyond health care and social care – that influence our health.
-
This analysis uses period life expectancy: the average number of additional years a person would live if they experienced the age-specific mortality rates of the given area and time period for the rest of their life.
-
Healthy life expectancy measures the number of years an individual is expected to live in good health, based on period life expectancy and a measure of self-rated health.
-
In this instance, self-rated health is a measure of health from the Annual Population Survey, adjusted by Census data, on a five-point scale from ‘very good’ to ‘very bad’. Other options include ‘good’, ‘fair’ and ‘bad’. Good health relates to people reporting their health as ‘very good’ or ‘good’.
-
Figures for healthy life expectancy at birth use single-tier Unitary authority estimates, and upper tier local authorities (such as County councils) estimates where these exist.
-
The size of the bubble represents the total population in the local authority as measured by the mid-year population estimates for 2020 from the Office for National Statistics.
Source: Office for National Statistics, Health state life expectancies, UK: 2017 to 2019