Key points
-
The number of years that a person can expect to live in good health varies across the UK. Men and women living in Scotland, the north of England and the South Wales Valleys tend to have a lower than average healthy life expectancy at birth. Those living in the south of England tend to have a higher than average healthy life expectancy at birth.
-
At upper-tier local authority level, there is a difference in healthy life expectancy at birth of 19.8 years for women and 17.8 years for men.
-
In the Orkney Islands female healthy life expectancy at birth is 75.0 years, while in Blackpool it is just 55.3 years.
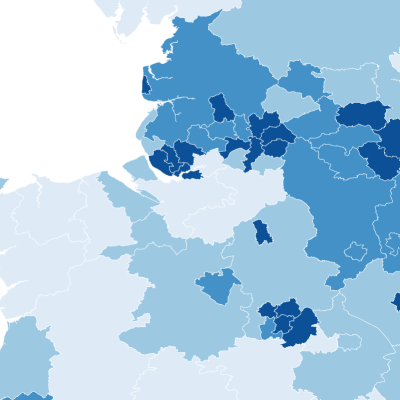
This map shows male and female healthy life expectancy at birth for each upper-tier local authority in the UK. Healthy life expectancy measures the number of years an individual is expected to live in good health, based on period life expectancy and a measure of self-rated health.
- The local authority with the highest female healthy life expectancy at birth is the Orkney Islands (75 years), followed by Brent (71.4 years), and Wokingham (70.1 years).
- The local authority with the highest male healthy life expectancy at birth is Rutland (71.5 years), followed by Richmond upon Thames (71.4 years) and Wokingham (70.1 years).
- Generally, the areas with the highest life expectancy at birth tend to be in London, the South of England and mid-Wales.
- The local authority with the lowest female healthy life expectancy at birth is Blackpool (55.3 years), followed by Nottingham (55.6 years) and North Ayrshire (56.3 years).
- The local authority with the lowest male healthy life expectancy at birth is Blackpool (53.7 years), followed by Belfast (54.4 years) and Glasgow (54.6 years).
- Of the 19 local authorities with a female healthy life expectancy at birth below 58 years, five are in Scotland, four are in Wales, and four are in the North West of England.
- Of the 19 local authorities with a male healthy life expectancy at birth below 58 years, four are in Wales, and there are three in each of Scotland, the North East of England, and Yorkshire and the Humber.
- In 44 local authorities (20.6% of all local authorities), both male and female healthy life expectancy at birth are below 60 years. Of these, eight are in the North West of England and seven are in Wales. None are in the South West or East of England.
People in the most deprived areas are expected to live less of their lives in good health. The government has acknowledged the need to ‘level up health’ and the importance of health to economic prosperity. There is a need for a whole government strategy to improve health and health equity, with a focus on the wider factors – beyond health care and social care – that influence our health.
-
This analysis uses period life expectancy: the average number of additional years a person would live if he or she experienced the age-specific mortality rates of the given area and time period for the rest of their life.
-
Healthy life expectancy measures the number of years an individual is expected to live in good health, based on period life expectancy and a measure of self-rated health.
-
In this instance, self-rated health is a measure of health from the Annual Population Survey, adjusted by Census data, on a five-point scale from ‘very good’ to ‘very bad’. Other options include ‘good’, ‘fair’ and ‘bad’. Good health relates to people reporting their health as ‘very good’ or ‘good’.
-
Healthy life expectancy at birth figures are for upper-tier local authorities.
-
Figures are not available for the City of London and Isles of Scilly due to the small population and small number of deaths. The Shetland Islands were removed for map scale reasons. Category size is based on 'quartile binning', to ensure an even number of local authorities in each category.
Source: ONS Geography Open Data; Office for National Statistics, Health state life expectancies, UK: 2017 to 2019