Relationship between persistent poverty and health
30 October 2023
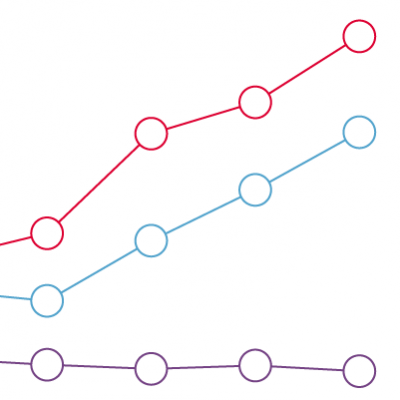
- 28% of adults aged 18–55 living in households in persistent poverty rate their health as less than good (fair or poor), which is higher than for adults in poverty (rather than persistent poverty) at 19% and not in poverty (15%).
- The relative ranking between the three groups shown on the chart has remained constant over time.
Persistent poverty is a particularly important issue for our health, because the experience of prolonged periods of poverty has cumulative effects, for example the build up of chronic stress and impact of life events over time. Research on child poverty found that any exposure to poverty in childhood was associated with worse health outcomes, but the effects were more severe for children living in persistent poverty.
The chart shows the proportion of adults aged 55 years and younger in persistent poverty, poverty or not in poverty who report their health as less than good (on a scale of ‘excellent’, ‘very good’, ‘good’, ‘fair’ or ‘poor’).
People living in persistent poverty had the worst health of any of the three groups in 2019/20.
- 28% of adults aged 55 years and younger living in persistent poverty reported less than good health.
- 19% of the same age group living in poverty reported less than good health.
- 15% of adults not in poverty had less than good health.
This ranking was constant over the time period covered: people in persistent poverty had worse health than people in poverty, and they, in turn, had worse health than people who were not in poverty.
Poverty in general has a negative impact on health, with persistent poverty being worse due to its prolonged nature. Policy action can reduce persistent poverty.
Persistent poverty is defined as an individual living in a household experiencing poverty (a net household income below 60% of the median in that year) for at least three of the past four years.
Income is adjusted for household size to reflect economies of scale. For example, a household of four people needs more income for the same standard of living as a household of one, but not four times as much.
Housing costs are deducted from income, to reflect that people with lower incomes in particular have fewer options for meeting their housing costs, relative to their income.
The three groups are formed in a hierarchy as follows.
- Persistent poverty: people living in poverty for three of the last four years of data.
- Poverty: people living in poverty in the current year of data.
- Not in poverty: everyone who is not covered by either definition.
Source: Health Foundation analysis of University of Essex - Institute for Social and Economic Research, Understanding Society, UK, 2013–14 to 2019–20.