Key points
- One fifth (22%) of the UK population live in poverty – equivalent to 14 million people.
- Before the pandemic, poverty rates for children and pensioners in 2019/20 rose to their highest since the 2008/9 financial crisis. For working-age adults, rates remained constant since 2015/16, reflecting how incomes have on one hand increased due to higher employment, and on the other fallen due to social security cuts.
- In 2021/22, poverty rates for working-age adults (20.2%) and pensioners (17.6%) had remained largely unchanged from 2019/20, but for children had fallen to 29.2%.
Poverty can affect health when financial resources are insufficient to meet basic living needs, such as adequate heating for the home, appropriate clothing or adequate nutrition.
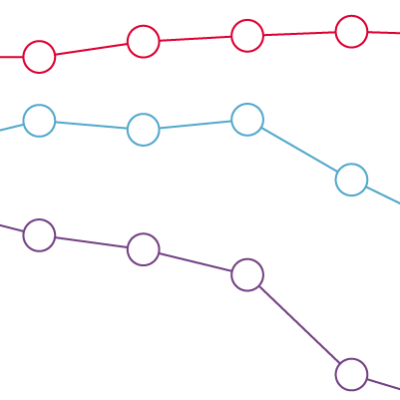
The chart shows the proportion of people living in poverty in the UK for each year from 1994/95 to 2021/22. The latest available data does not yet cover the current cost of living crisis which began in 2022/23. Data is separated by all people, children, working-age adults and pensioners.
A total of 22% of the UK population – around 14 million people – live in poverty, a figure that has changed little since the mid-2000s.
The relatively static overall (all people) measure hides considerable variation between age groups:
- Child poverty fell from 34% to 28% between 1998/99 and 2004/05, which is seen as a result of social policy success, such as Child Tax Credit. The child poverty rate has remained at around 30% since 2005/06 with a fall in 2010/11, largely due to median income falling after the financial crisis. Before the COVID-19 pandemic, child poverty was forecast to rise, driven by the phasing in of the policy of limiting some social security payments to two children. However, the child poverty rate in 2021/22 is at 29.2% – remaining in line with levels prior to the pandemic.
- The proportion of working-age people in poverty across this time period has remained broadly consistent at around one in five (20%).
- The poverty rate for pensioners more than halved between the late 1990s and its low point (13.3%) in 2012/13, although it crept up to 18% in 2021/22. The reduction in pensioner poverty up until 2012/13 was partly due to the introduction of more generous financial support through Pension Credit.
Within each group, the composition of the population in poverty has shifted. For people of working age and with children, this includes the growth of in-work poverty (people in work and still in poverty) and a shift towards more families privately renting (where housing costs are higher). There have been similar shifts for working-age adults.
- Poverty is defined as an individual living in a household with a net household income below 60% of the median in that year.
- Income is equivalised, which means it is adjusted for household size to reflect economies of scale: for example, a household of four needs more income for the same standard of living as a household of one, but not four times as much.
- Housing costs are deducted from income, to reflect that people with lower incomes in particular have fewer options for meeting their housing costs, relative to their income.
- Pensioner households are defined as those headed by a person aged 65 years or older.
- The category ‘pensioner’ is the technical term used in the statistics produced by the Department for Work and Pensions. ‘Pensioner’ is not our preferred wording at the Health Foundation but is accurate to use in this context.
- Northern Ireland data is only included in the survey from 2002/03 onwards.
- Data for 2020/21 is not included in line with the Department for Work and Pensions’ guidance related to data quality during the COVID-19 pandemic.
- Data for 2021/22 have also been affected by the pandemic and are subject to additional uncertainty. The changes between 2019/20 and 2020/21 should be viewed with caution and not in isolation from broader trends.
Source: Department for Work and Pensions, Households Below Average Income: The Income Distribution Summary Tables: UK, 2021/22