Relationship between employment and health
5 October 2022
Key points
-
A local area’s employment rate is related to how long people are likely to live (life expectancy) and how many years they can expect to live in good health (healthy life expectancy).
-
In places with higher economic inactivity, people are more likely to have a lower healthy life expectancy.
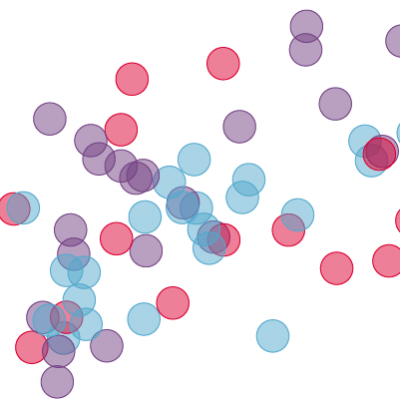
This chart shows the connection between healthy life expectancy (how many years a person can expect to live in good health) and a local area’s employment and economic inactivity rates by gender. Local areas are shown at the upper tier local authority level for England. Each chart highlights the local authority’s relative level of deprivation, whether in the most deprived (bottom) 20%, the middle 60% or the least deprived (top) 20%.
Both employment and economic inactivity levels are related to healthy life expectancy for both men and women.
People who live in areas with high employment rates are more likely to live longer. And, there is a positive correlation between an area’s employment rates and both men’s and women’s healthy life expectancy.
Conversely, the healthy life expectancy of both men and women is negatively affected by economic inactivity. People living in an area with higher economic inactivity are more likely to have a lower healthy life expectancy.
This suggests there is some association at an area level between health and employment. This relationship can go both ways: unemployment can harm health, and poor health makes it harder to find or sustain employment.
It is worth noting that the most deprived areas, despite having employment rates around the median, have below-average health outcomes. This suggests other factors play a significant role in shaping health outcomes as well as employment.
Health and employment vary significantly between local areas in the UK. Policies that improve health could potentially increase employment rates, while policies to boost access to – and the availability of – good-quality work could also contribute to better health outcomes.
All data are for the 3-year period between 2018 and 2020 and are measured at the level of upper tier local authorities in England, which are the level of counties, London boroughs, unitary authorities and metropolitan districts.
Source: ONS, Unemployment and underemployment statistics; Labour Force Survey, unemployment data, 2022.