Relationship between number of negative job aspects and health
23 June 2022
Key points
-
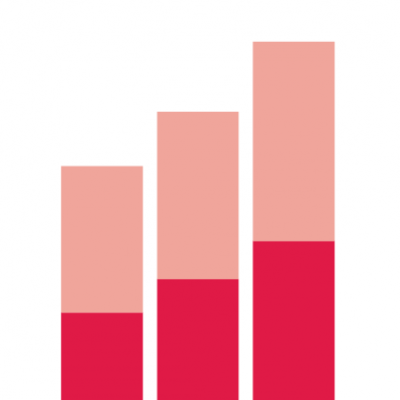
The proportion of employees who report ‘less than good’ (fair or poor) health increases as people experience more negative aspects of job quality.
-
32.2% of employees with three or more negative aspects of job quality report less than good health, compared with 8.8% of employees who experience no negative aspects of job quality.
This chart shows the differences in self-reported health with increasing numbers of negative aspects of job quality. Each individual’s experiences at work are assessed according to five aspects of job quality: job satisfaction, job well-being, job autonomy, job security and pay.
The percentage of employees with less than good health increases with each additional negative job aspect. The proportion reporting poor or fair health with no negative job aspects is 8.8%. For one negative job aspect it is 14.5%; for two it is 19.9%; and for three or more it is 32.2%.
It is unlikely that this relationship can be explained simply by the age composition of each group, as younger employees are more likely to experience low-quality work on these measures.
Jobs with multiple negative aspects are associated with worse health. This suggests that any strategy to improve job quality should focus on raising the standards of the ‘worst’ jobs with multiple negative aspects.
This indicator adapts and builds on measures used by Chandola and Zhang and is based on available data from the University of Essex Understanding Society survey.
Aspects of low-quality work are measured as follows:
- low job satisfaction – employees who report feeling somewhat, mostly or completely dissatisfied with their job
- low job autonomy – across five dimensions of job autonomy, an average score indicating little to no autonomy
- low job wellbeing – across six measures of emotional perceptions of jobs (whether it inspires feelings of tension, unease, worry, depression, gloom or misery), an average score indicating these feelings most or all the time
- low job security – perception that job loss is either likely or very likely in the next 12 months
- low pay – earnings are below two-thirds of UK hourly median pay. The questions are asked of employees only aged 18–55 (self-employed people are excluded) and are specific to each job they hold.
Source: University of Essex, Understanding Society, The UK Household Longitudinal Study, 2022