Unfortunately, your browser is too old to work on this website. Please upgrade your browser
Skip to main content

About this article

The charts in this analysis highlight three ‘myths’ that were prevalent at the very start of the pandemic. We use a common measure ‘years of life lost’ to describe what each death meant.

Key points

Myth 1: ‘Those who die from COVID-19 would have died soon anyway’

  • In the first year of COVID-19 (5 March 2020 to 5 March 2021), 1.5 million potential years of life were lost in the UK as a result of people dying with the virus. In England and Wales alone this figure is 1.4 million.
  • On average, each of the 146,000 people who died with COVID-19 lost 10.2 years of life.

Myth 2: ‘It’s just a bad flu season’

  • In a bad flu year on average around 30,000 people in the UK die from flu and pneumonia, with a loss of around 250,000 life years. This is a sixth of the life years lost to COVID-19.
  • We have more detailed data for England and Wales. This shows us that, even looking only at those aged older than 75 (who account for most COVID-19 and flu deaths) – COVID-19 has been much more deadly. In 2018, a bad flu year, around 25,000 people older than 75 died from flu or pneumonia. These people lost a total of 140,000 years of life – 5.75 years each on average. This is about a quarter of the life years lost among those older than 75 from COVID-19.
  • More years of men's lives have been lost in the pandemic than women’s. Again, looking at England and Wales, women older than 75 lost around four-times more years of life than for a bad flu season; for men it was five times higher.

Myth 3: ‘COVID-19 is the great leveller – we are all equally at risk’

  • COVID-19 was not the great leveller. People in the 20% most deprived parts of England were twice as likely to die from COVID-19 as those in the least deprived areas. They also died at younger ages, so may have lost more years of life. While existing health inequalities mean these people may have had lower life expectancy, the analysis found that in total, 35% more lives were lost in the 20% most deprived areas than the least, with 45% more years of life lost in total. 
  • On average, each person who died in the most deprived quintile lost 11 years of their life, compared with 10 years in the least deprived.
 

Introduction

It's been a year since COVID-19 took hold in the UK, and we have produced three charts highlighting some of the myths that were prevalent at the very start of the pandemic – around who would die, how COVID-19 compared to flu, and that COVID-19 would kill ‘indiscriminately’, paying no attention to wealth or ethnicity.

For each chart we use a common measure ‘years of life lost’, to describe what each death meant.


What do we mean by 'years of life lost'?

Years of life lost is a way of estimating how long someone would have lived, had they not died from COVID-19. To calculate it, we use life tables. These tables tell us the life expectancy of someone at each age – for example, they tell us that a man aged 80 in England or Wales could expect to live 8.2 more years, a woman 9.7. If a man aged 80 died from COVID-19 we therefore assume he has ‘lost’ 8.2 years of life. By summing all these lost years we come up with an overall estimate of the total years lost due to COVID-19.

There are limitations to this method. Primarily, we have used average life expectancies at each age – when we know it is likely that those who died from COVID-19 were more likely to have co-morbidities than their peers, and therefore may have had lower life expectancies. We may therefore have overestimated the number of years of life lost. However, our estimates do not include the additional deaths that occurred during the pandemic but were not directly caused by COVID-19.


Myth 1: ‘Those who died from COVID-19 would have died soon anyway’

In the year since the start of March 2020, around 1.5 million years of life have been lost from COVID-19 in the UK.

On average, each person who died with COVID-19 lost 10.2 years of life. Looking at England and Wales alone the years of life lost was 1.4 million years, with a greater loss for men (around 750,000 years lost, 55% of the total), than for women (around 600,000 years lost, 45%). While women can expect to live longer than men (so would ‘lose’ more years of life if they died at the same age) men have been up to around twice as likely to die from COVID –19 as women of the same age.

Even if we look only at deaths among people older than age 75, a total of 600,000 years of life have been lost – around 6.5 years for each death.


Myth 2: ‘It’s just a bad flu season’

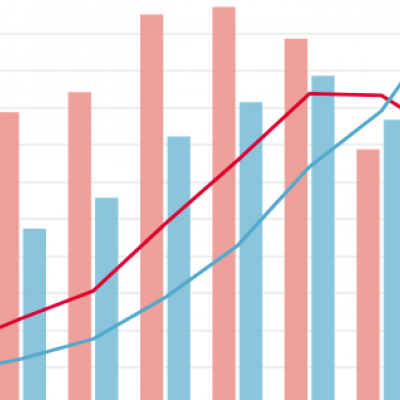
In a particularly bad flu year on average around 30,000 people in the UK die from flu and pneumonia, with a loss of around 250,000 life years. This is just a sixth of the life years lost to COVID-19.

We have more detailed data for England and Wales. This shows us that, even looking only at those aged older than 75 (who account for most COVID and flu deaths), COVID-19 has been much more deadly. Take 2018, a ‘bad’ flu year, when around 25,000 of those older than 75 died. They lost a total of 140,000 years of life, an average of 5.75 years per person. This is less than a quarter of the life years lost among those older than 75 from COVID-19. And that is despite the huge mitigation measures – lockdowns etc – used to manage COVID-19. Had we treated COVID-19 like we treat flu, and not introduced those measures, the death toll would have been much higher.

In terms of mortality, COVID-19 was particularly bad for men, compared with flu. The years of life lost for men older than 75 was around five times higher than in 2018’s bad flu year; for women it was four times higher.


Myth 3: ‘COVID-19 is the great leveller – we are all equally at risk’

People living in the most deprived fifth of areas of England were two to three times more likely to die than people of the same age living in the least deprived areas.

This inequality is also seen in numbers of deaths, which are 35% higher in the poorest areas than in the wealthiest. This is despite the fact that more deprived areas tend to have younger populations, so would be expected to have fewer deaths.

Looking at the years of life lost, we see that, on average, those dying from COVID-19 in the poorest fifth of areas lost 11 years of life, compared with 10 years lost in the wealthiest areas. This difference is because those dying in the poorest areas were younger. Putting this together with the higher number of deaths in the poorest areas, we estimate that the poorest areas have lost 45% more life years than the wealthiest.

Further reading

Kjell-bubble-diagramArtboard 101 copy

Get social

Follow us on Twitter
Kjell-bubble-diagramArtboard 101

Work with us

We look for talented and passionate individuals as everyone at the Health Foundation has an important role to play.

View current vacancies
Artboard 101 copy 2

The Q community

Q is an initiative connecting people with improvement expertise across the UK.

Find out more