Health and social care funding explained
16 January 2017
This content was produced in January 2017 and is now out of date.
For more recent analysis of health and social care funding visit:
- Health and social care funding (November 2019)
- The bigger picture: learning from two decades of changing NHS care in England (October 2020)
- Social care funding gap (October 2020)
January 2017
The UK currently spends over £140bn a year on public provision of health and over £20bn on social care. But how does that break down and how has spending changed over time? The charts below cover some of the key past, present and future trends in funding and activity across the UK and in England.
Please note that the data in these charts are in 2016/17 prices Using HM Treasury September 2016 GDP deflators.
We have tried, wherever possible, to present data for the whole of the UK, however in some instances this has not been possible and so we give an England-only picture.
More detail on the definitions used for health.
The historic trends
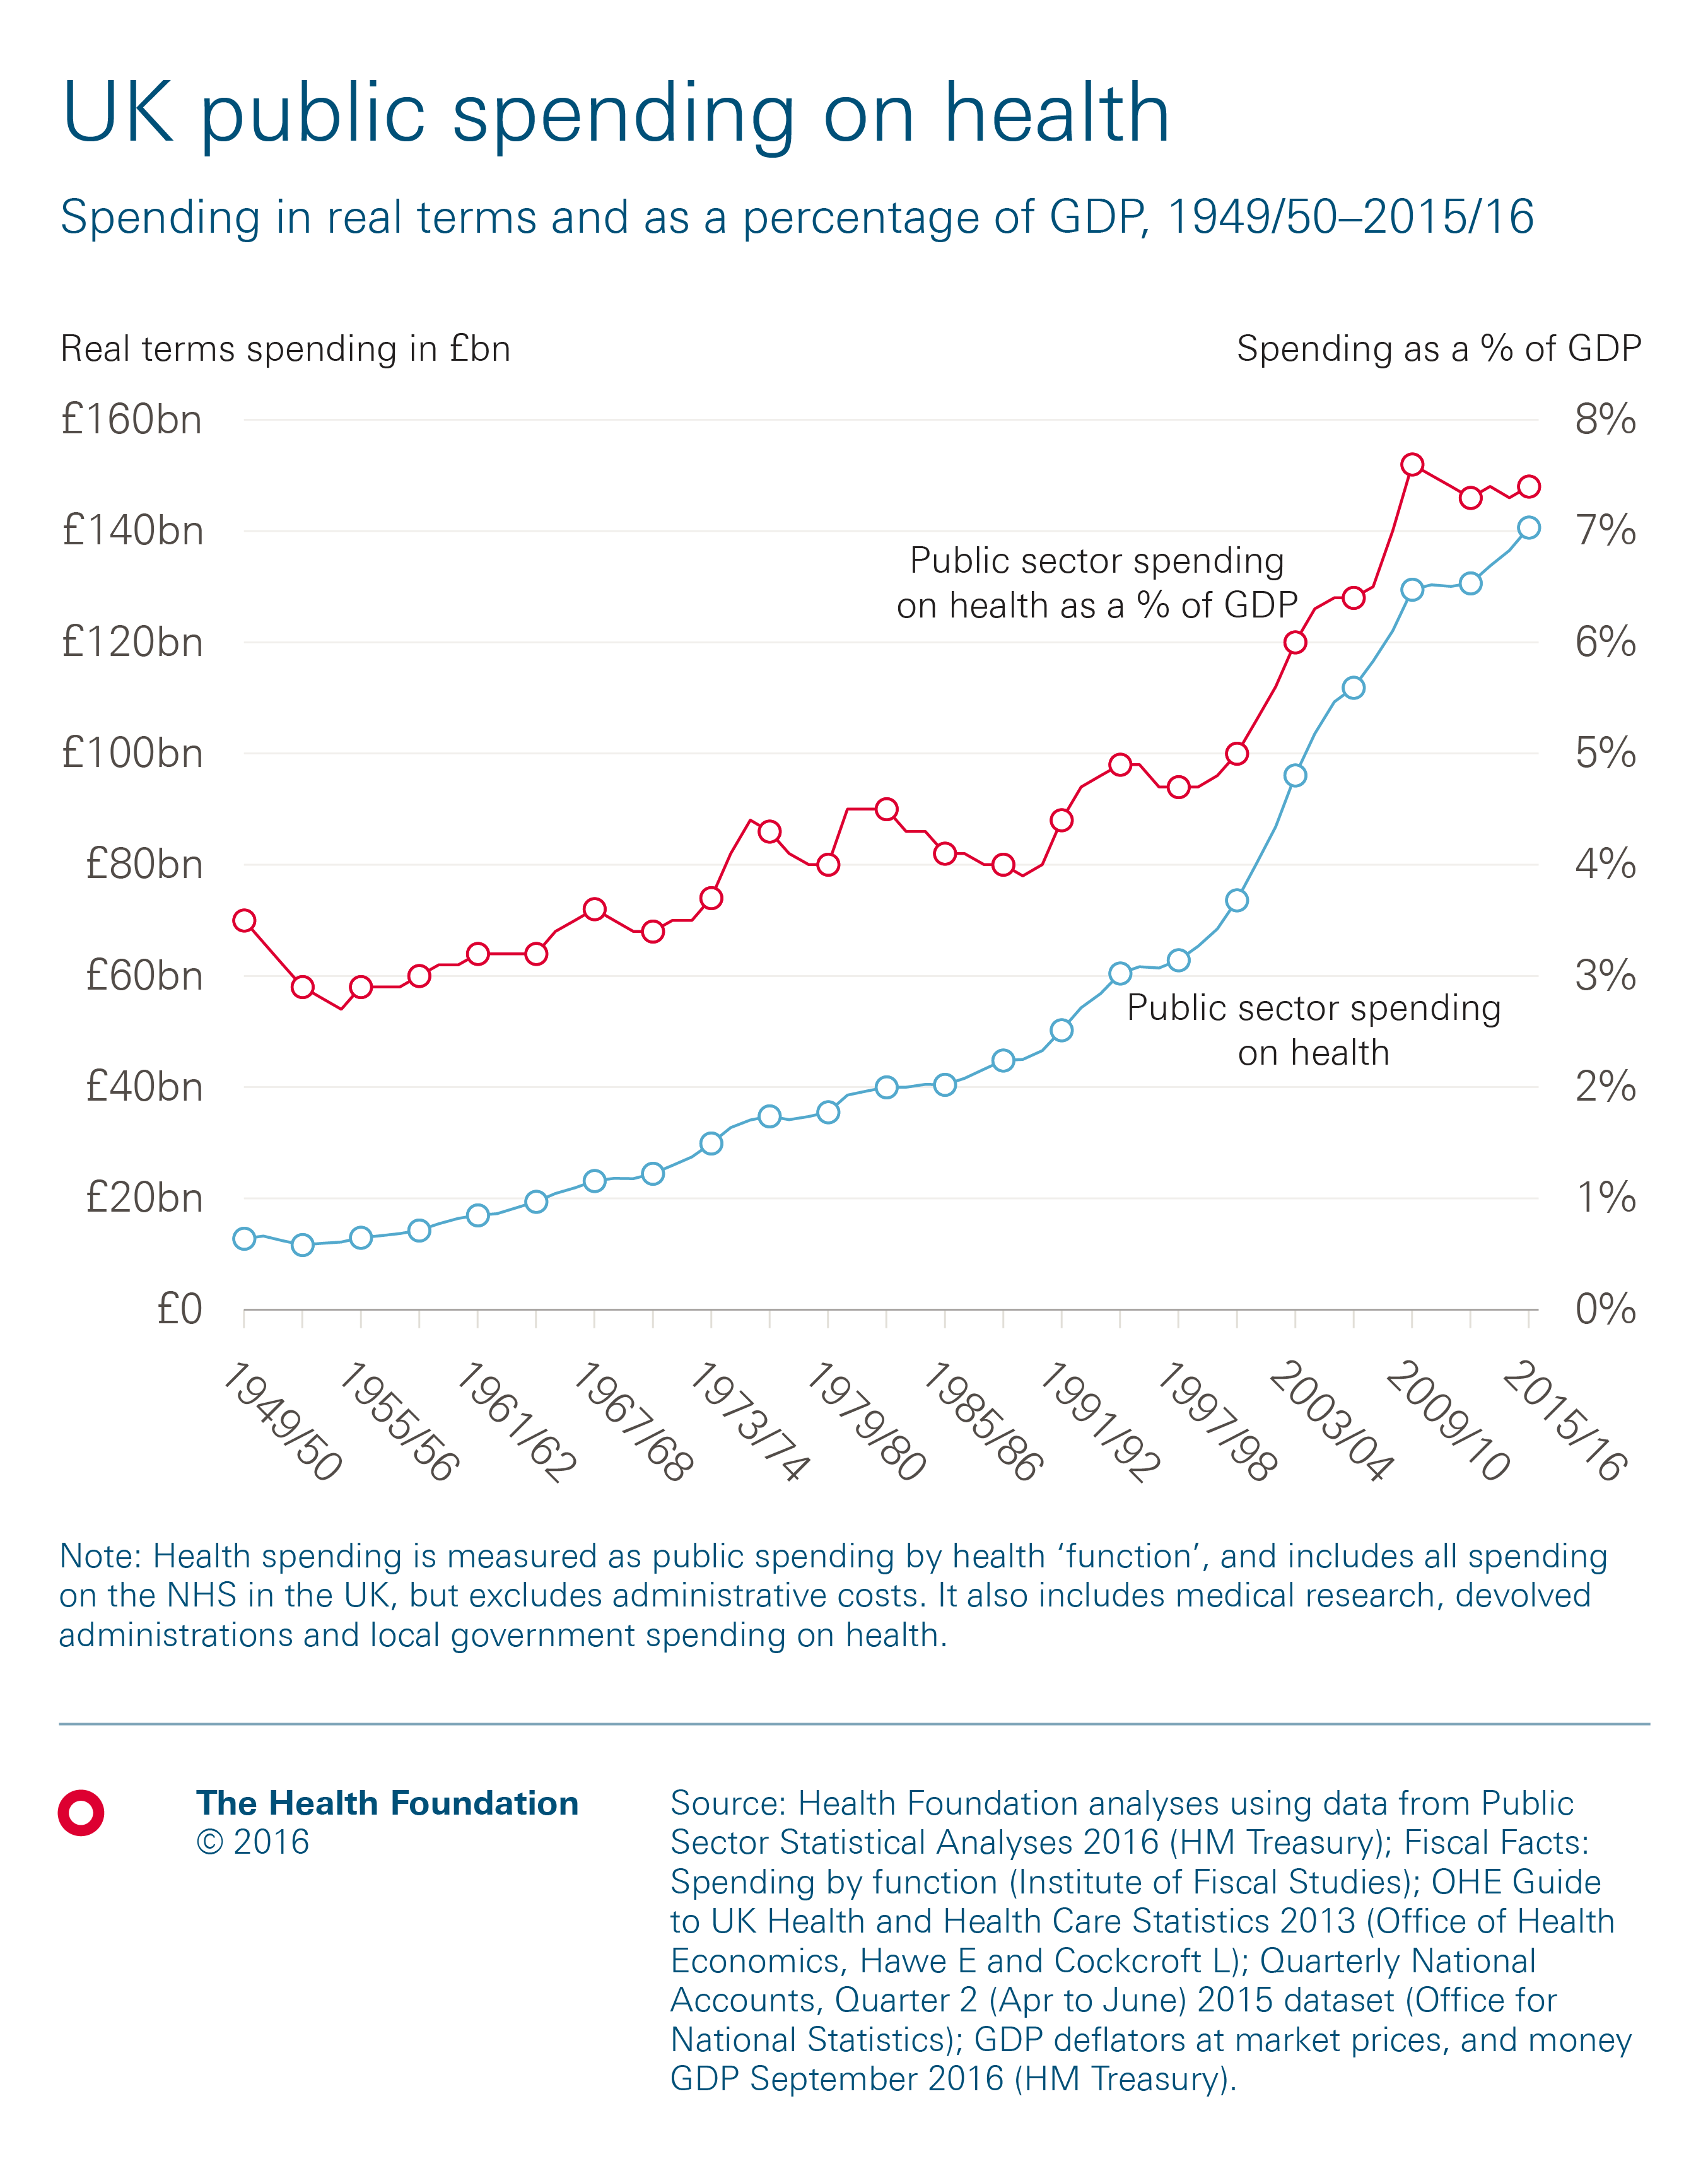
In 2015/16 the total spend on health in the UK was £140.6bn, nearly 11 times more than when it was established in 1948, in real terms. Public funding for health care has increased faster than economic growth, with the share of UK GDP more than doubling from 3.5% in 1949/50 to 7.4% in 2015/16. On average, spending has risen by 3.7% a year in real terms, but it hasn’t been a continued steady increase over this time – there have been periods of relatively high and low growth.
And what about spending on social care?
In 2015/16 about £16bn was spent on public provision of adult social services in England, based on net total spending. This figure is about £14bn if you do not include the transfers from the NHS to social care made through the Better Care Fund. Using this measure, this is twice the amount spent in 1994/95, but 17% lower than when spending was at its peak in 2010/11.
The amount spent on adult social care has decreased every year since 2010/11, if you do not include transfers from the NHS. If you do then there was a real terms increase this year.

How has spending on health changed over different parliaments?
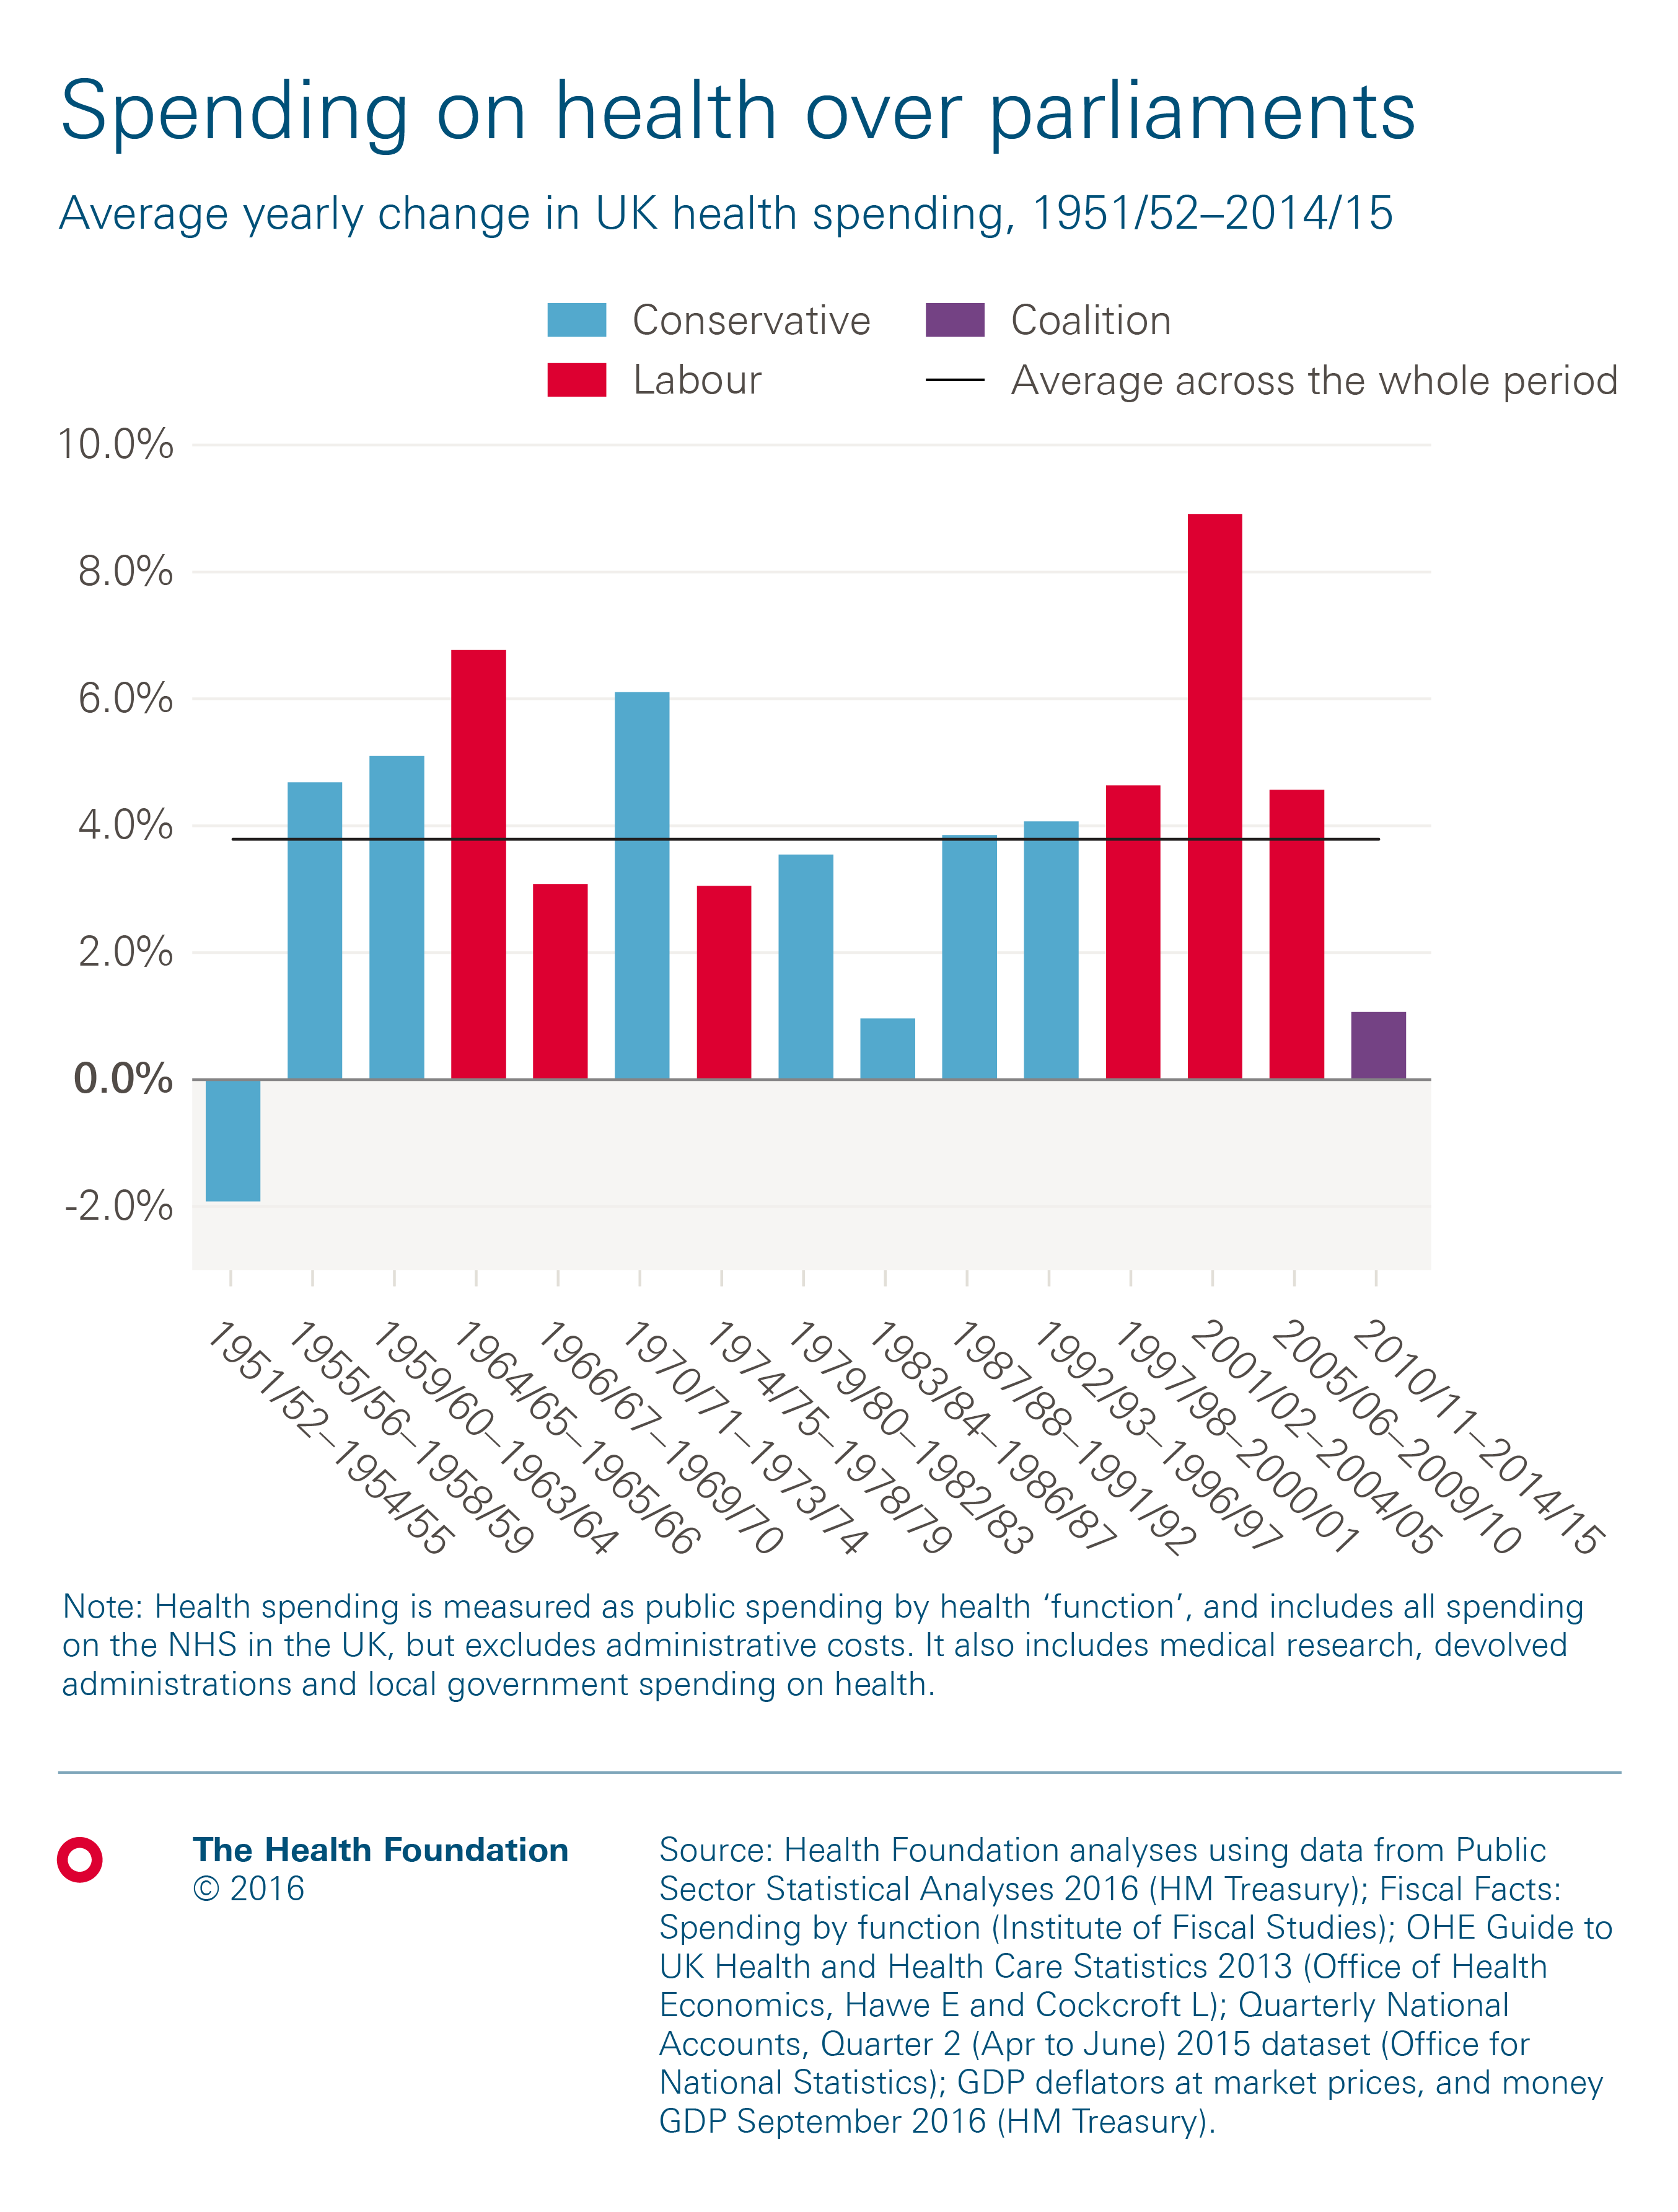
Public spending on health care is ultimately driven by the population need, resources available and national priorities. So while spending has increased at an average of 3.7% a year since the NHS was created, growth has varied between different parliaments. The highest rate of growth during any parliament was an average of 8.9% between 2001/02 and 2004/05, with a commitment by Tony Blair’s Labour government to raise spending on health care to the EU average.
A key priority for the coalition government between 2010/11 and 2014/15 was to reduce the national fiscal deficit. While health spending was protected relative to other public spending, this was one of the lowest periods of funding growth in the history of the NHS, rising by an average of 1.1% a year.
And how does the UK’s spending on health compare to other European countries?
It’s worth noting that a new method of accounting for health spending means that health-related social care and long-term care are now included in countries’ spending on health. This gives a wider definition of spending on health, rather than just narrowly on health care. This data was first published comparably in 2016. The new definition means that figures (provided to the OECD by the ONS) for the UK’s spending on health are higher than under previous definitions, which had typically not included these areas of spending.
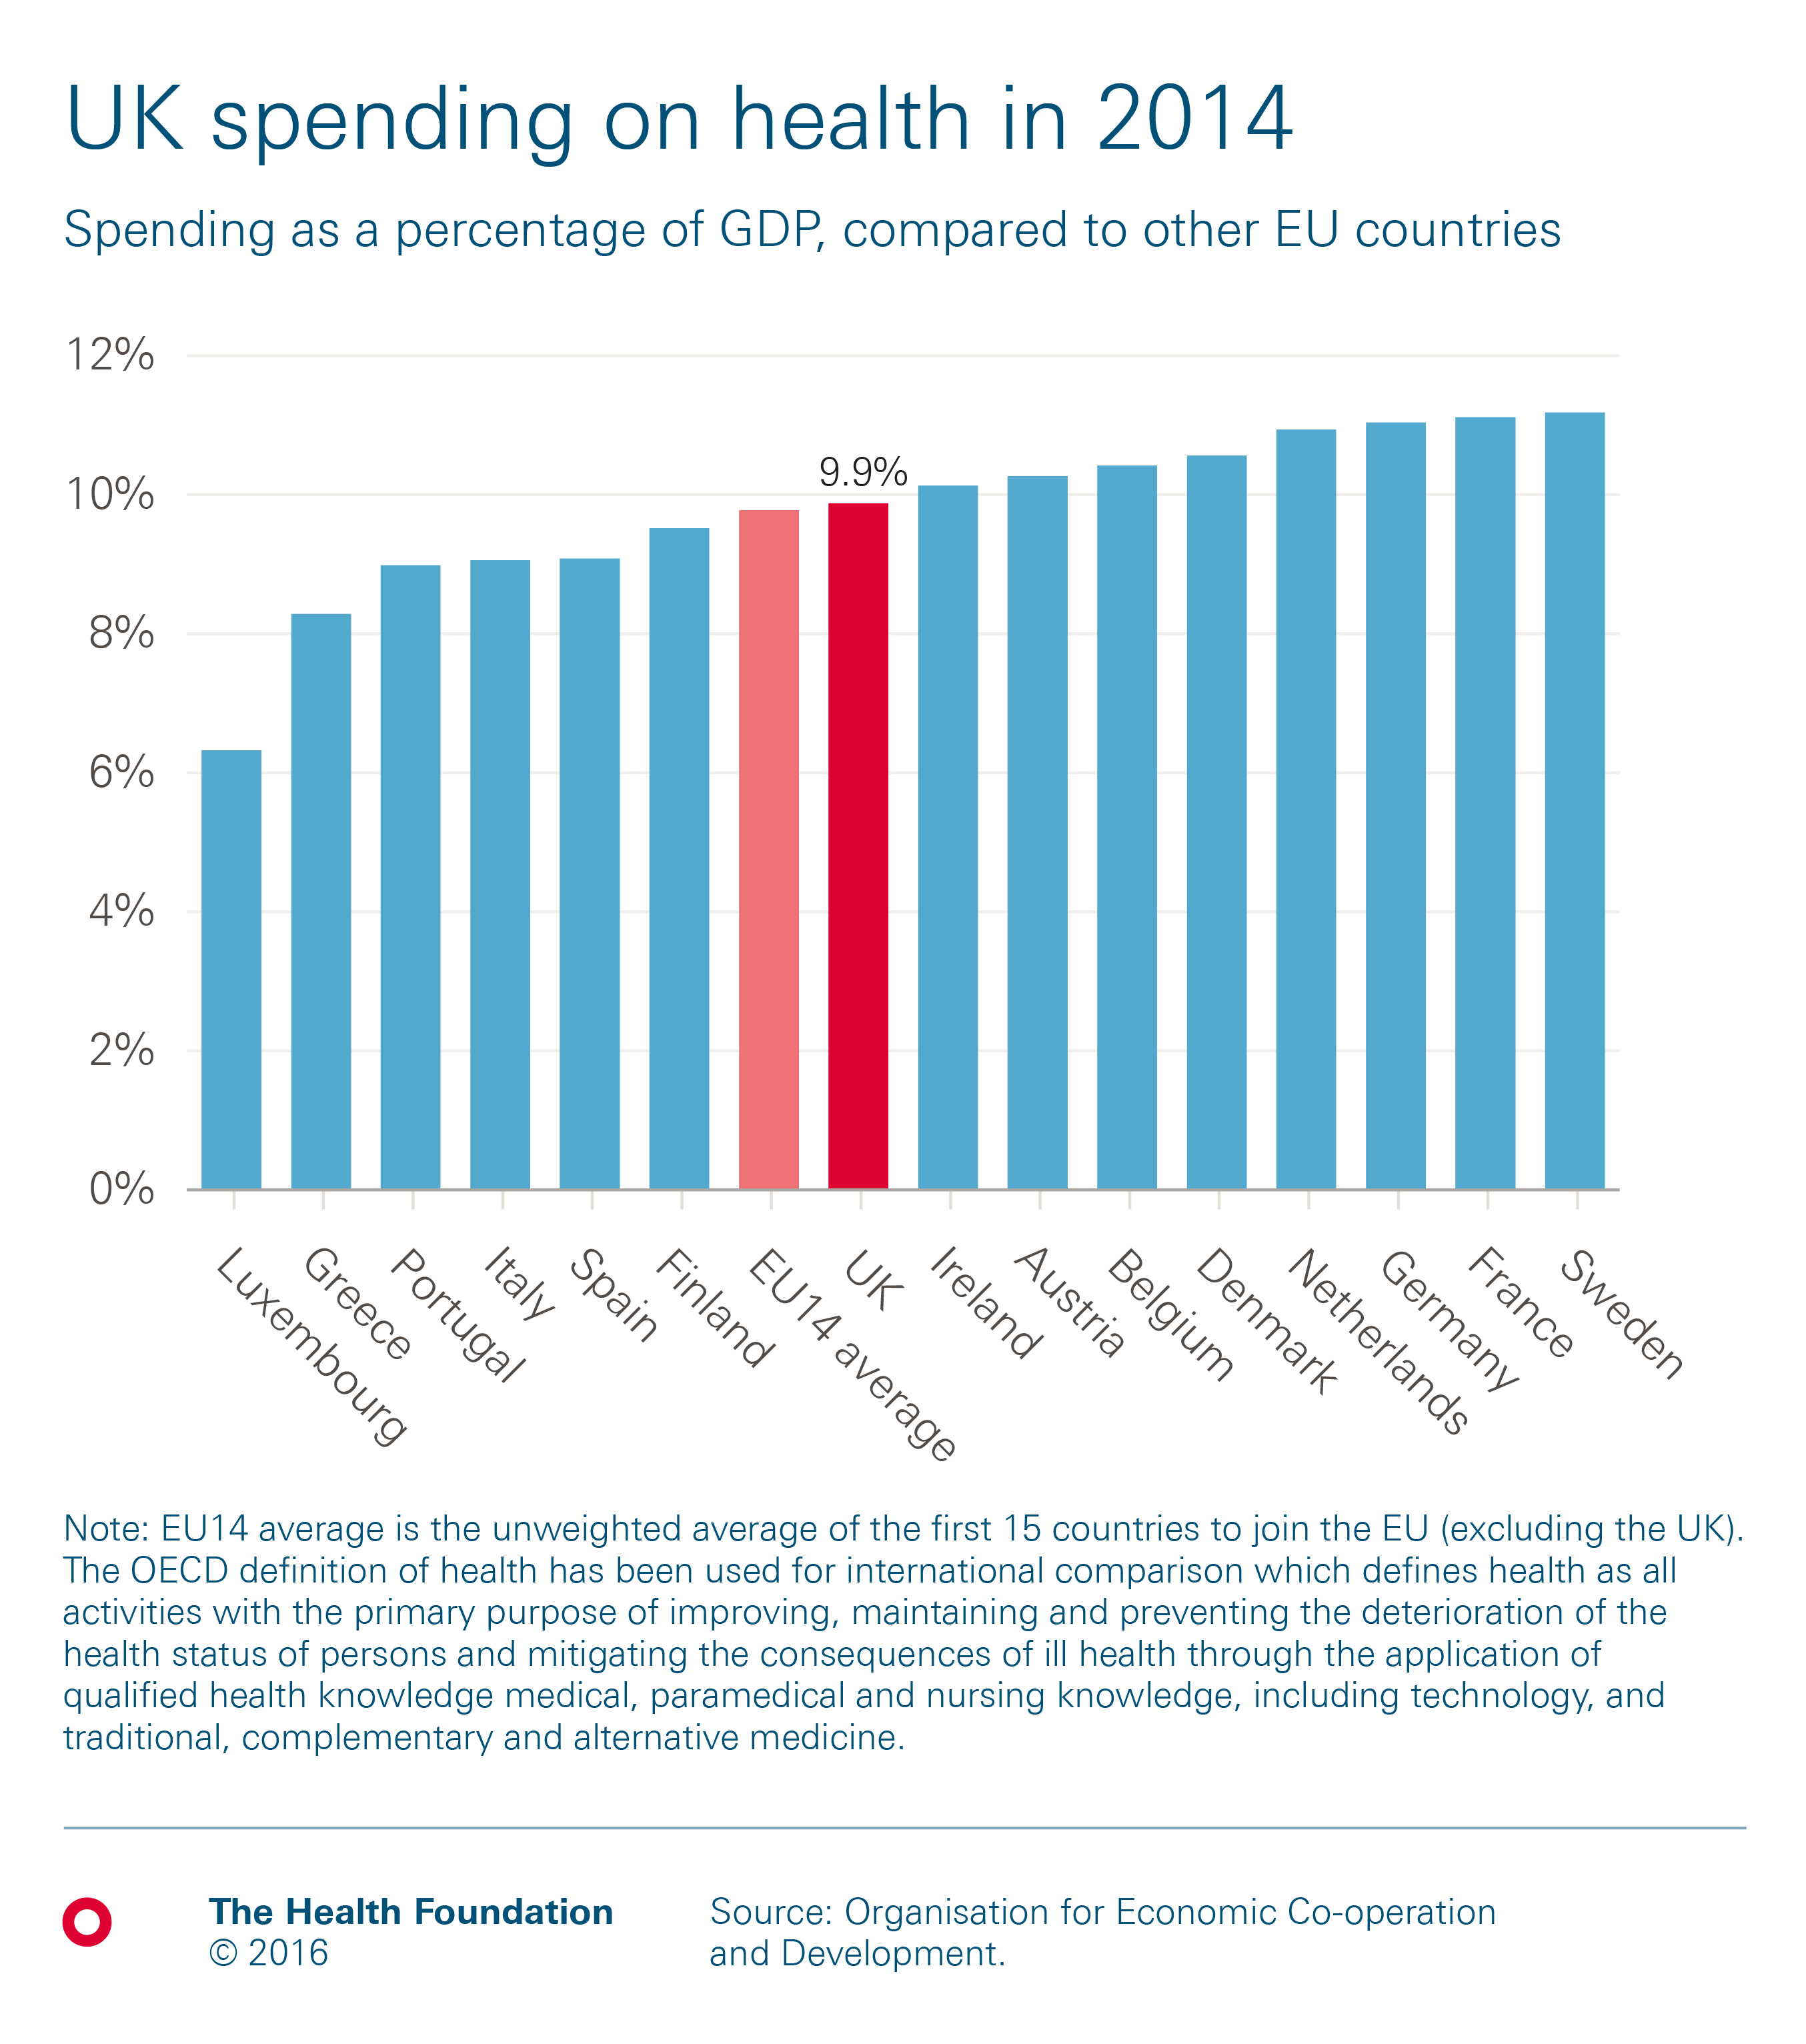
Total spending on health in the UK was worth 9.9% of GDP in 2014. This is similar to the EU-14 average of 9.8%, excluding the UK (the EU-14 refers to the first 15 countries to join the EU, excluding the UK). The UK spends less on health as a percentage of GDP than eight of the other countries.
The majority (80%) of health in the UK is publicly funded, predominantly through the NHS. In 2014, the UK’s public spending on health was 7.9% of GDP. This was higher than the EU-14 average of 7.5%, but lower than five other countries in the group. This chart shows all spending either by government or by compulsory insurance schemes, which are more common in mainland Europe.
 How does health spending differ between countries within the UK?
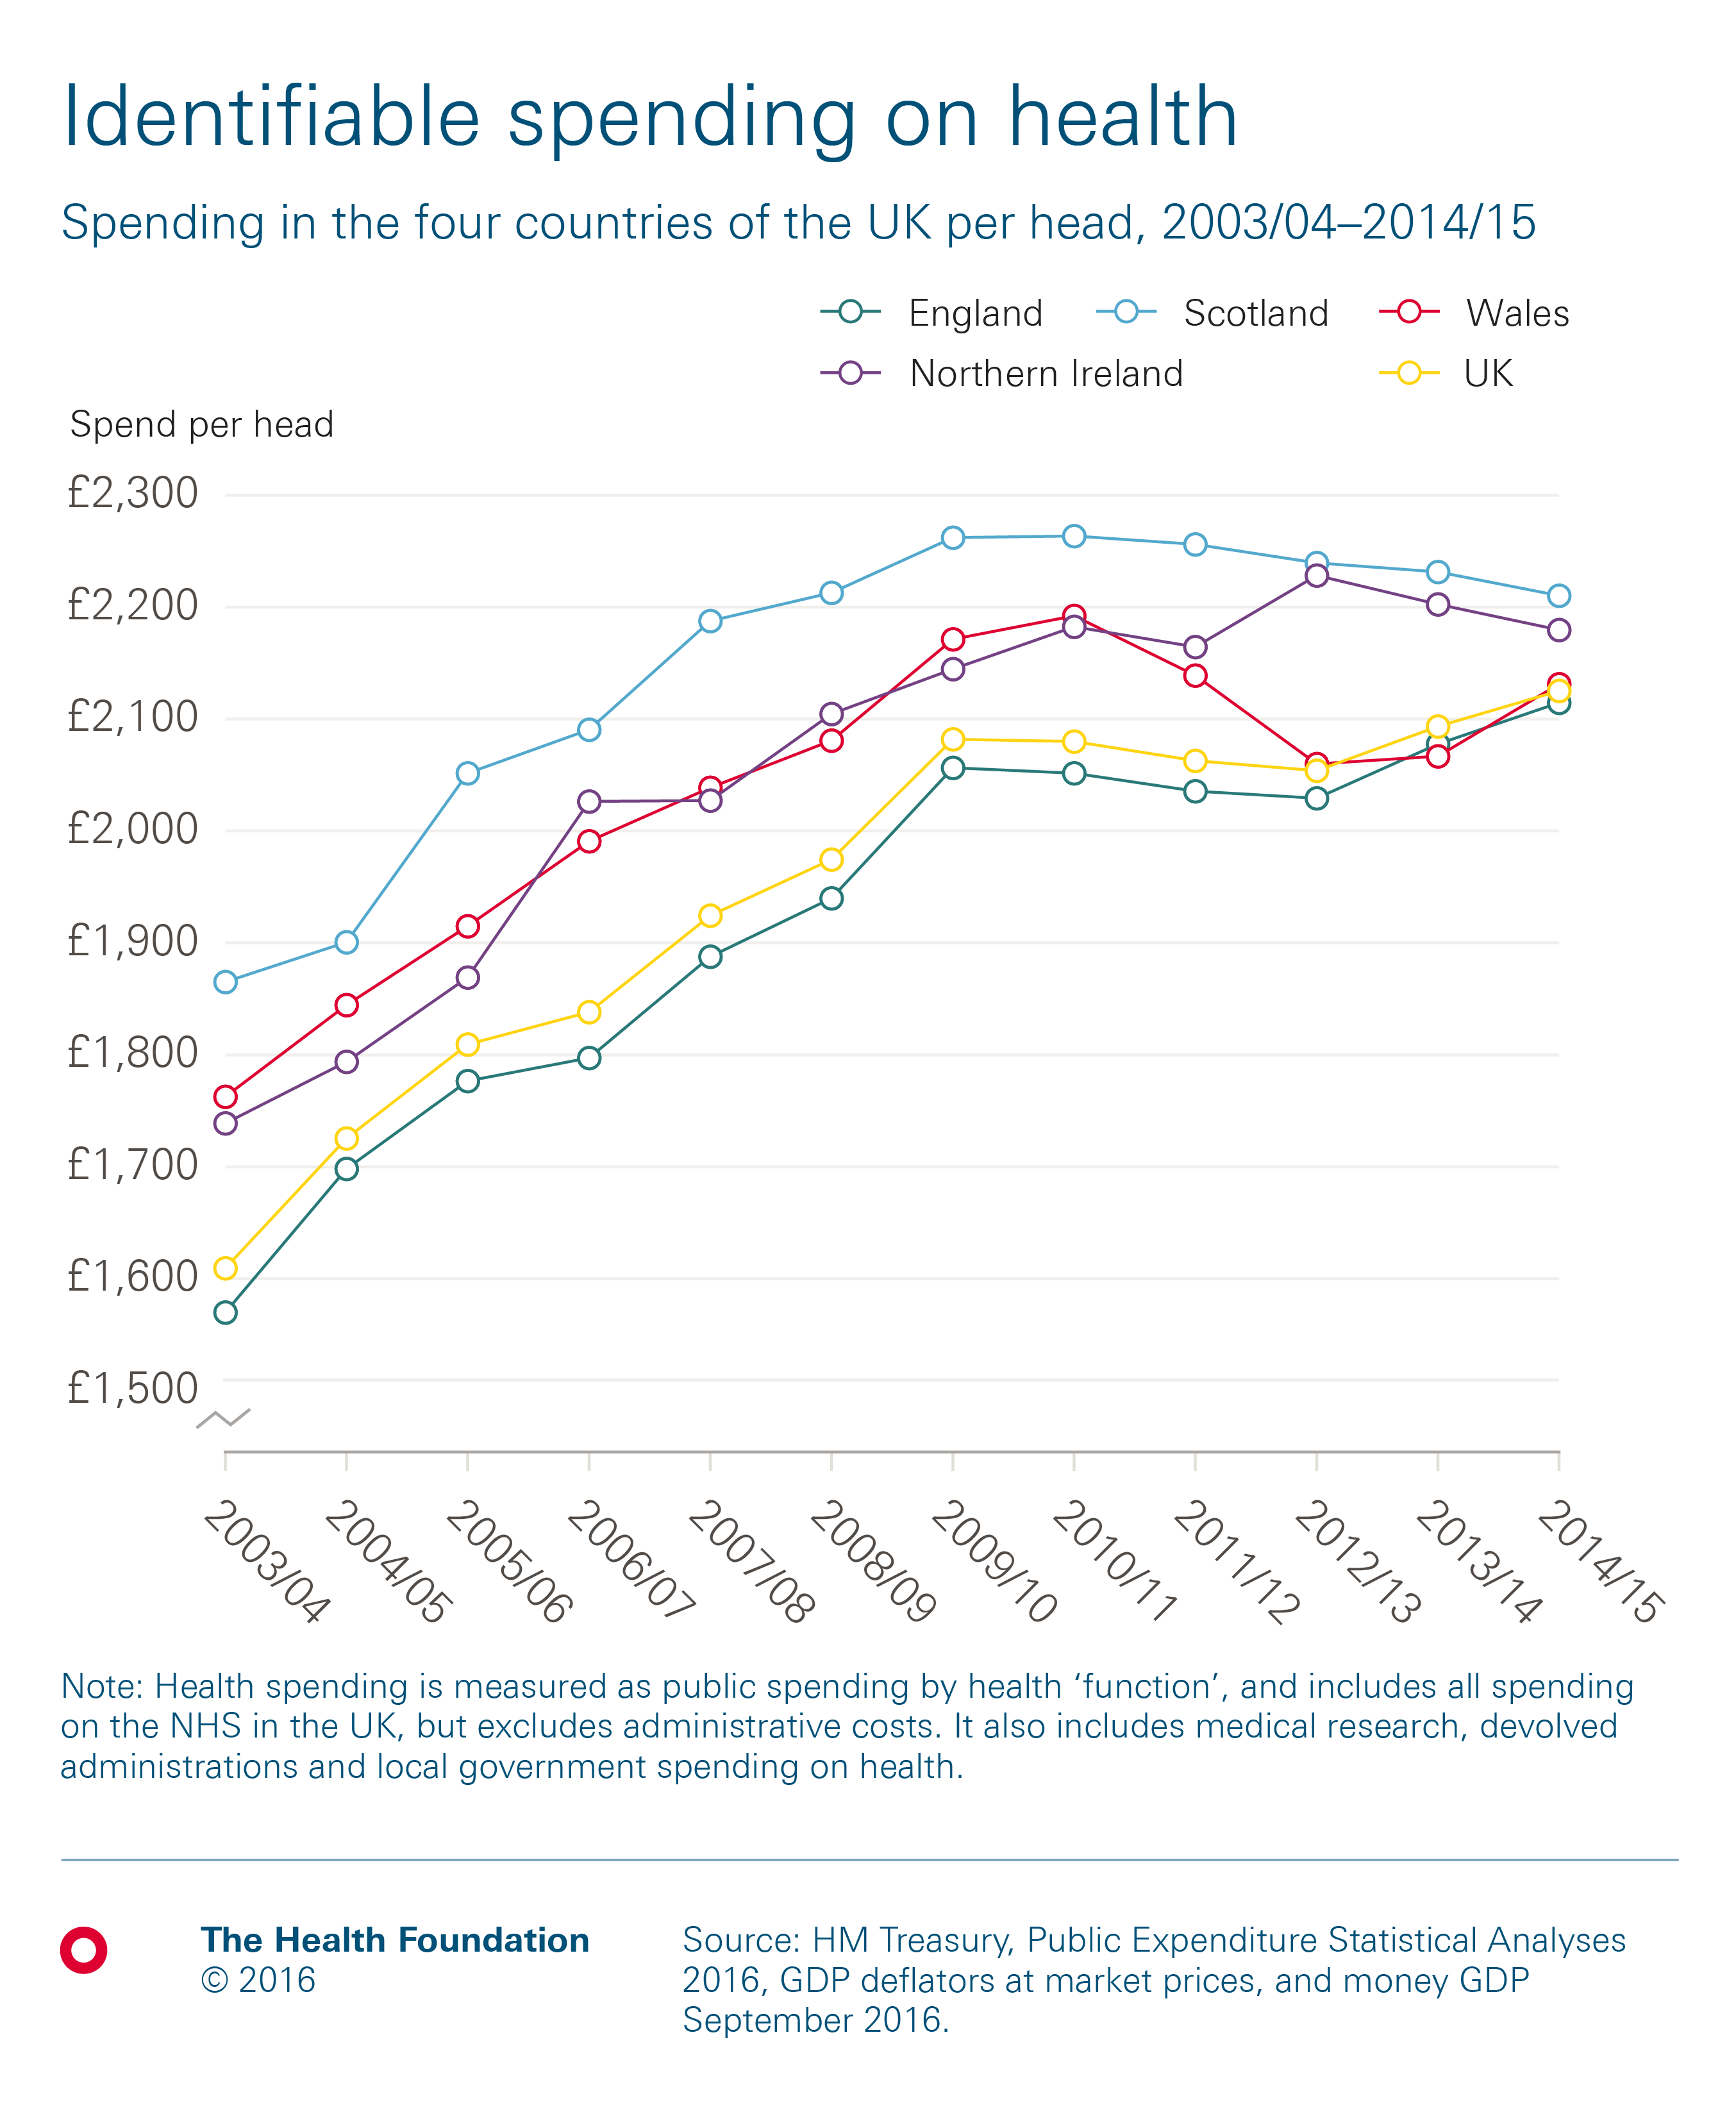
The simplest way to compare health spending across the UK is using spend per head. Although this doesn’t account for differences in the need for care, it provides a useful comparison.
Historically, health spending per head in the UK has been lowest in England and highest in Scotland. In all four countries, the amount has generally risen each year until 2009/10, after which patterns have diverged, reflecting different political decisions made by the respective government in each country.
In 2014/15, health spending per head across the four UK countries was:
- Scotland: £2,208
- Northern Ireland: £2,177
- Wales: £2,129
- England: £2,112
 So how does spending per head on social care differ between the four countries?
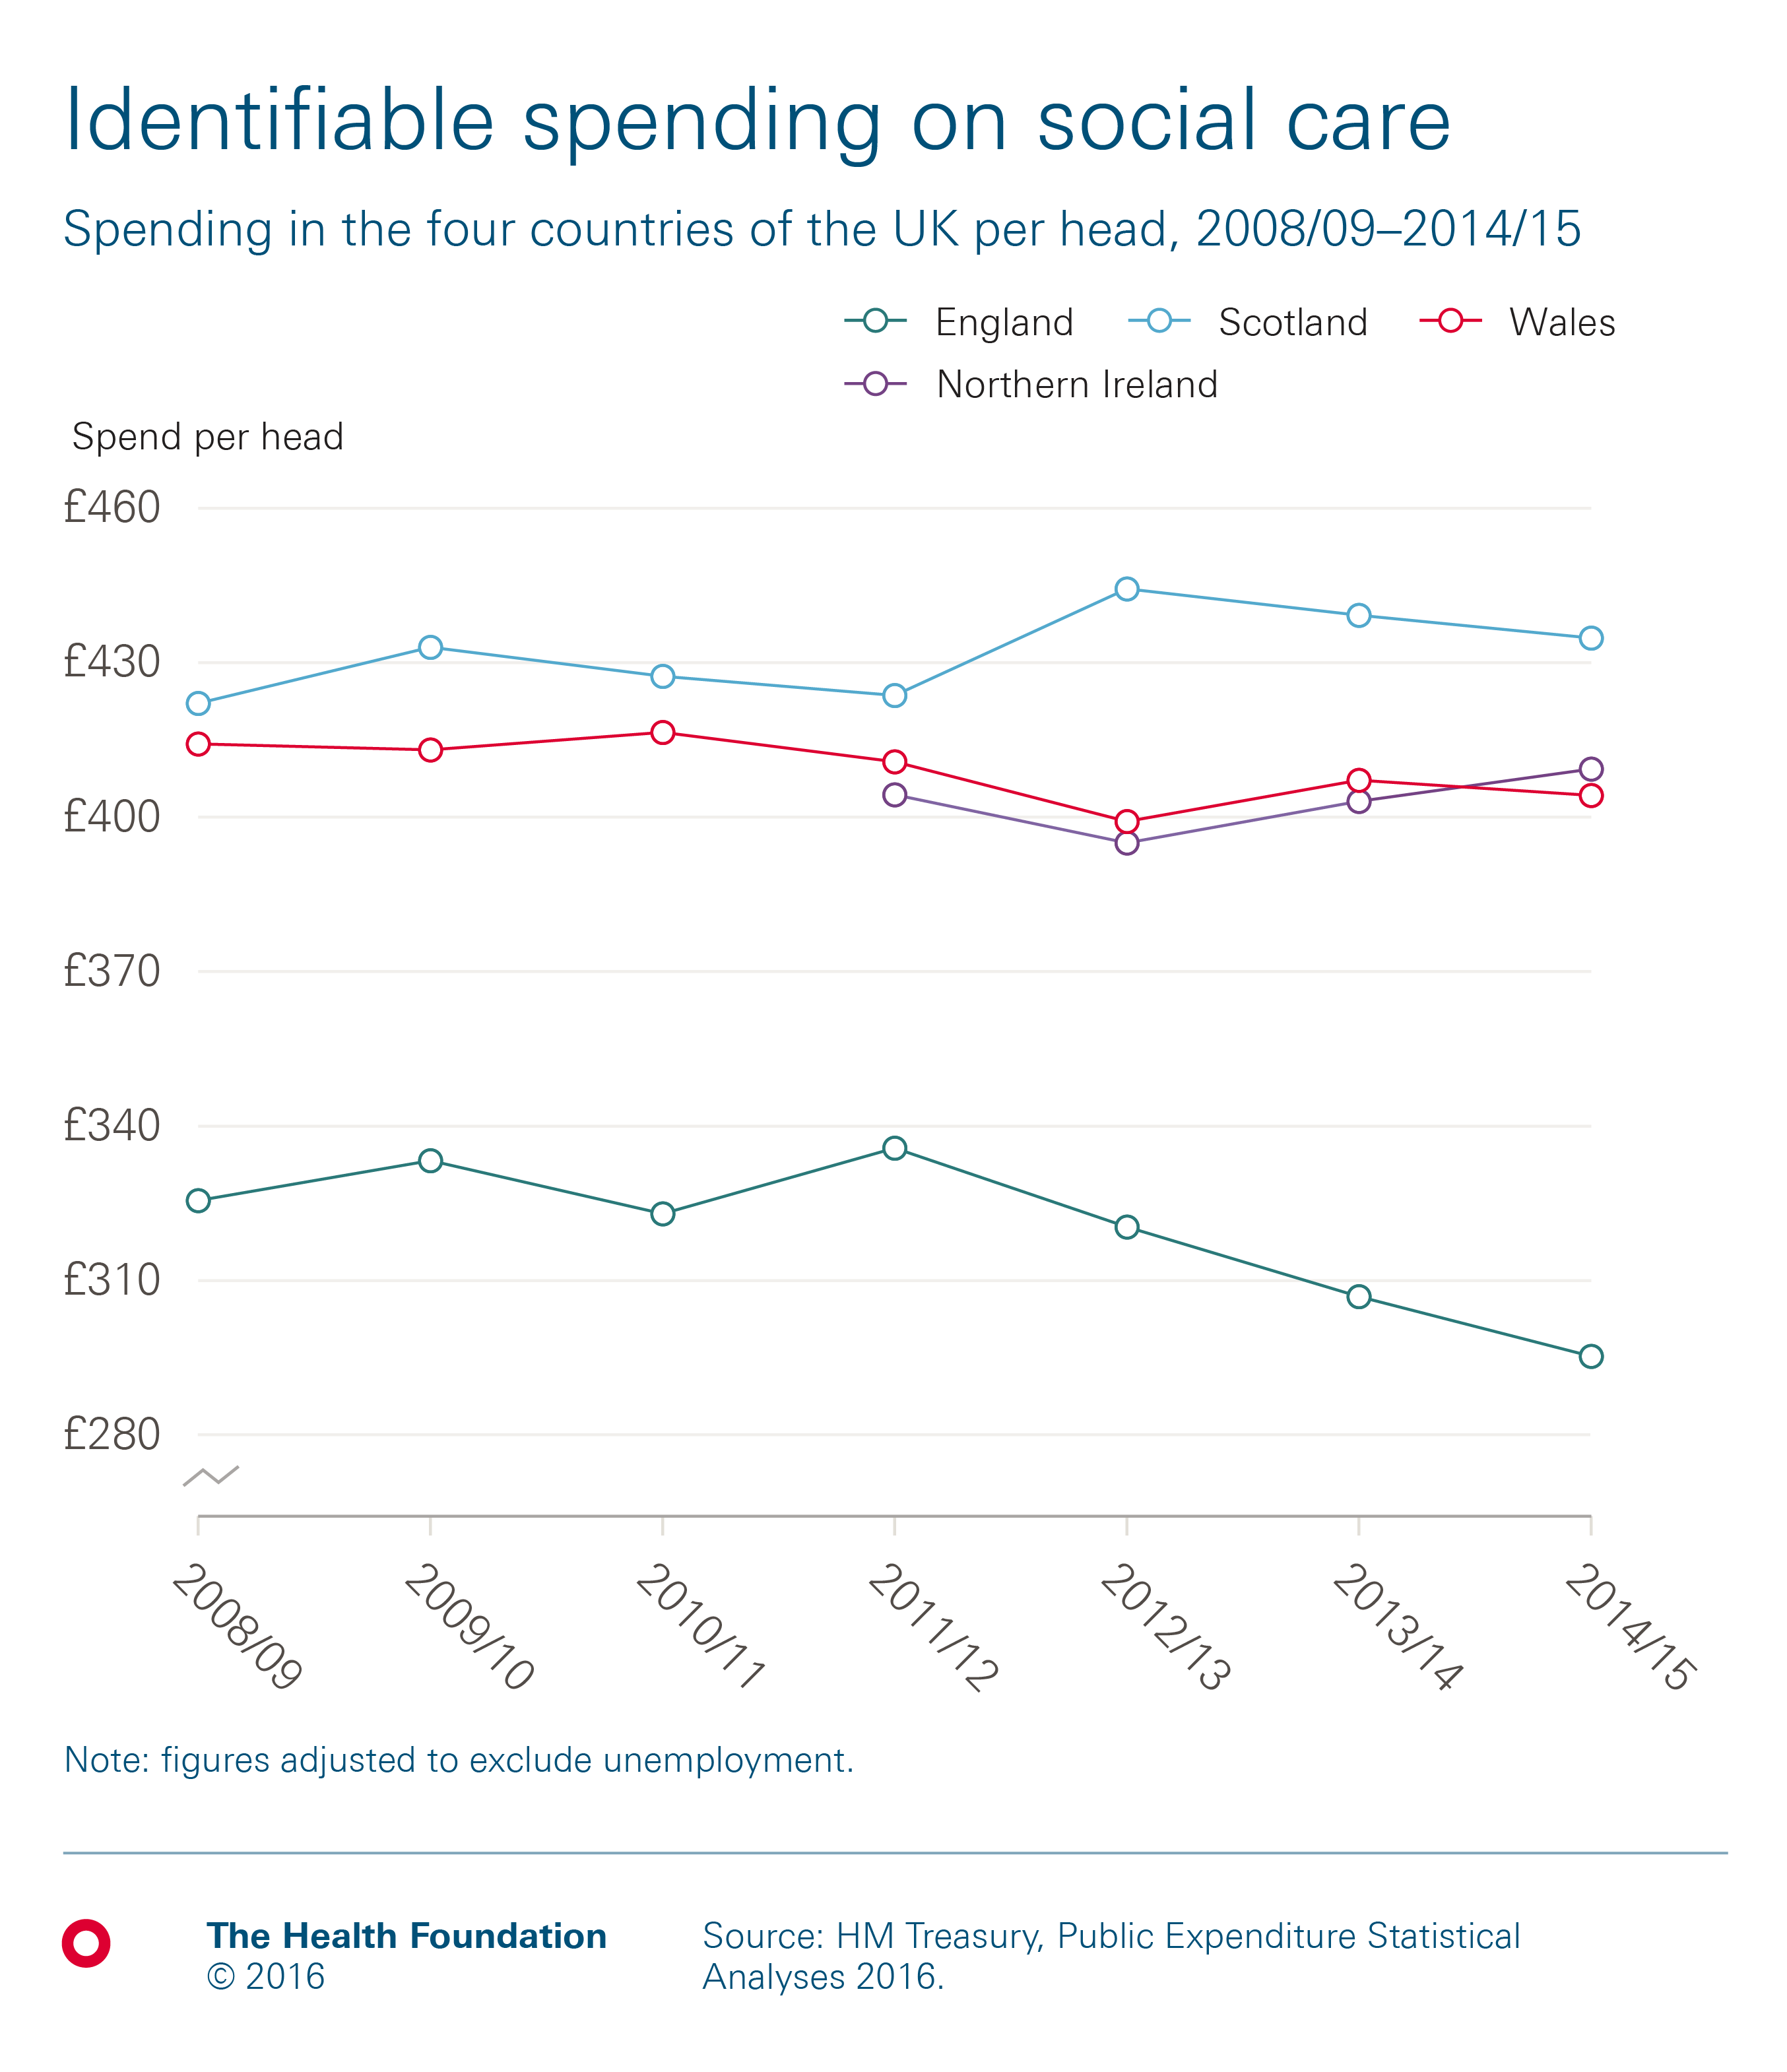
Public spending on adult social care varies for each country in the UK, from £295 per head in England, to £435 in Scotland, both in real terms. This is partly explained by a difference in relative need for the populations, and decisions made by the respective devolved governments.
In Scotland, where total spend per head is highest, funding has risen by an average of 0.5% a year in real terms between 2008/09 and 2014/15, During the same period, funding per head has fallen in England and Wales, by an average of 1.6% and 0.4% a year respectively. A consistent time series is not available for Northern Ireland before 2011/12, after which spending per head has risen by an average of 0.4% a year in real terms.
How has productivity grown?
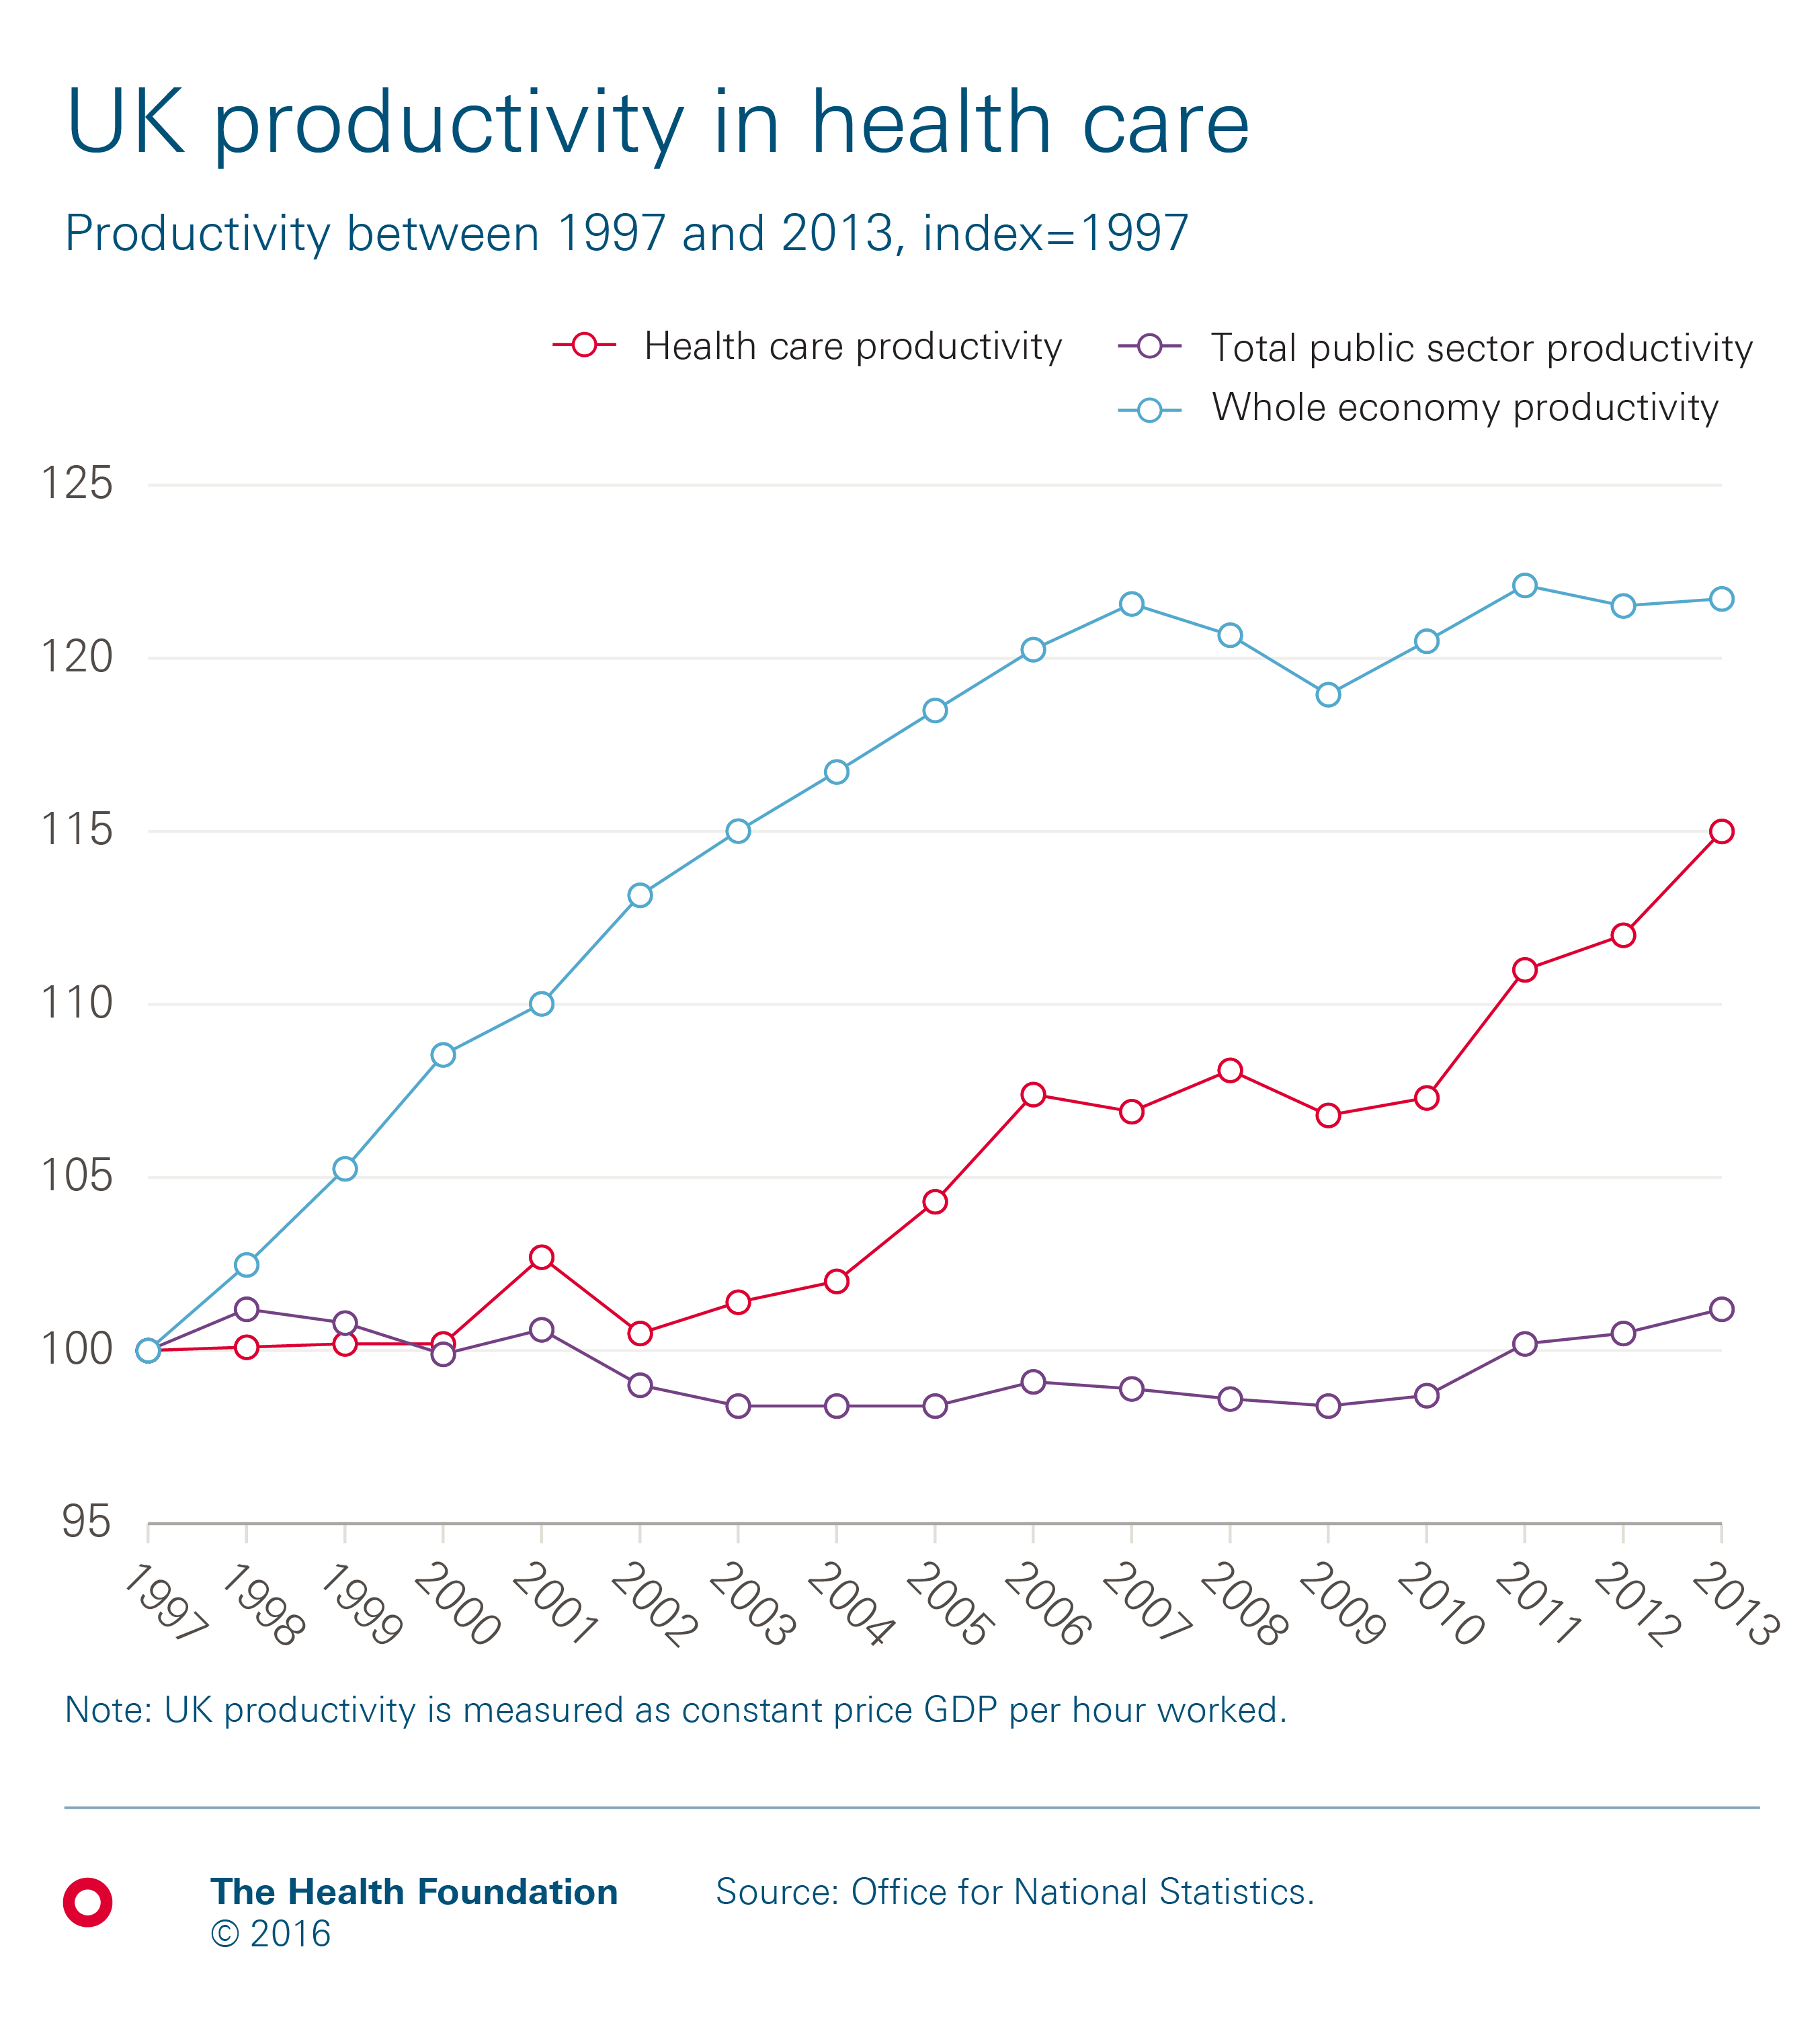
Productivity in the health care sector is only growing slowly, and can’t compensate for these other pressures. Between 1997 and 2013, productivity across the UK NHS grew by an average of 0.9% a year. This is higher than the total productivity of the public sector (0.1%) but lower than that of the whole UK economy (1.2%). Hospital productivity in the English NHS has been much lower, rising by only 0.1% per year between 2009/10 to 2014/15.
What is the current picture?
In recent years, financial pressures have been a prominent issue for the NHS. Let’s take a look at the current situation in England.
How has the financial performance of English NHS trusts changed?
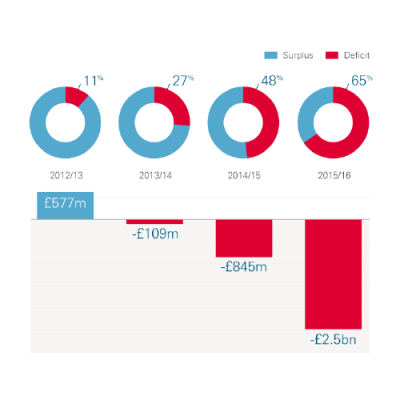
The NHS budget is under increasing strain and trusts in England have seen a steep decline in their financial performance, finding it difficult to balance the books. In 2015/16 NHS providers reported a net deficit of £2.5bn – a sharp decline from 2012/13 when providers last achieved a net surplus. The proportion of trusts reporting a net deficit rose from 12% in 2012/13 to 65% in 2015/16. Pressures are still being felt this year – in the second quarter of 2016/17 the NHS deficit was £648m.
 How do current funding plans compare to the historic trends?
Although NHS funding is rising in real terms, current plans mean that 2009/10 to 2020/21 will be the most austere decade in NHS history. Total spending on the NHS in England increased by an average of 1.2% a year under the 2010-15 coalition government (0.9% for the UK), and is set to increase at the same rate under the current Conservative government. Between 2009/10 and 2015/16, spending increased from £109.1bn to £119.0bn and is planned to rise to £123.2bn in 2020/21. This growth rate of around 1% is below the historical average for the UK of 3.7% per year.
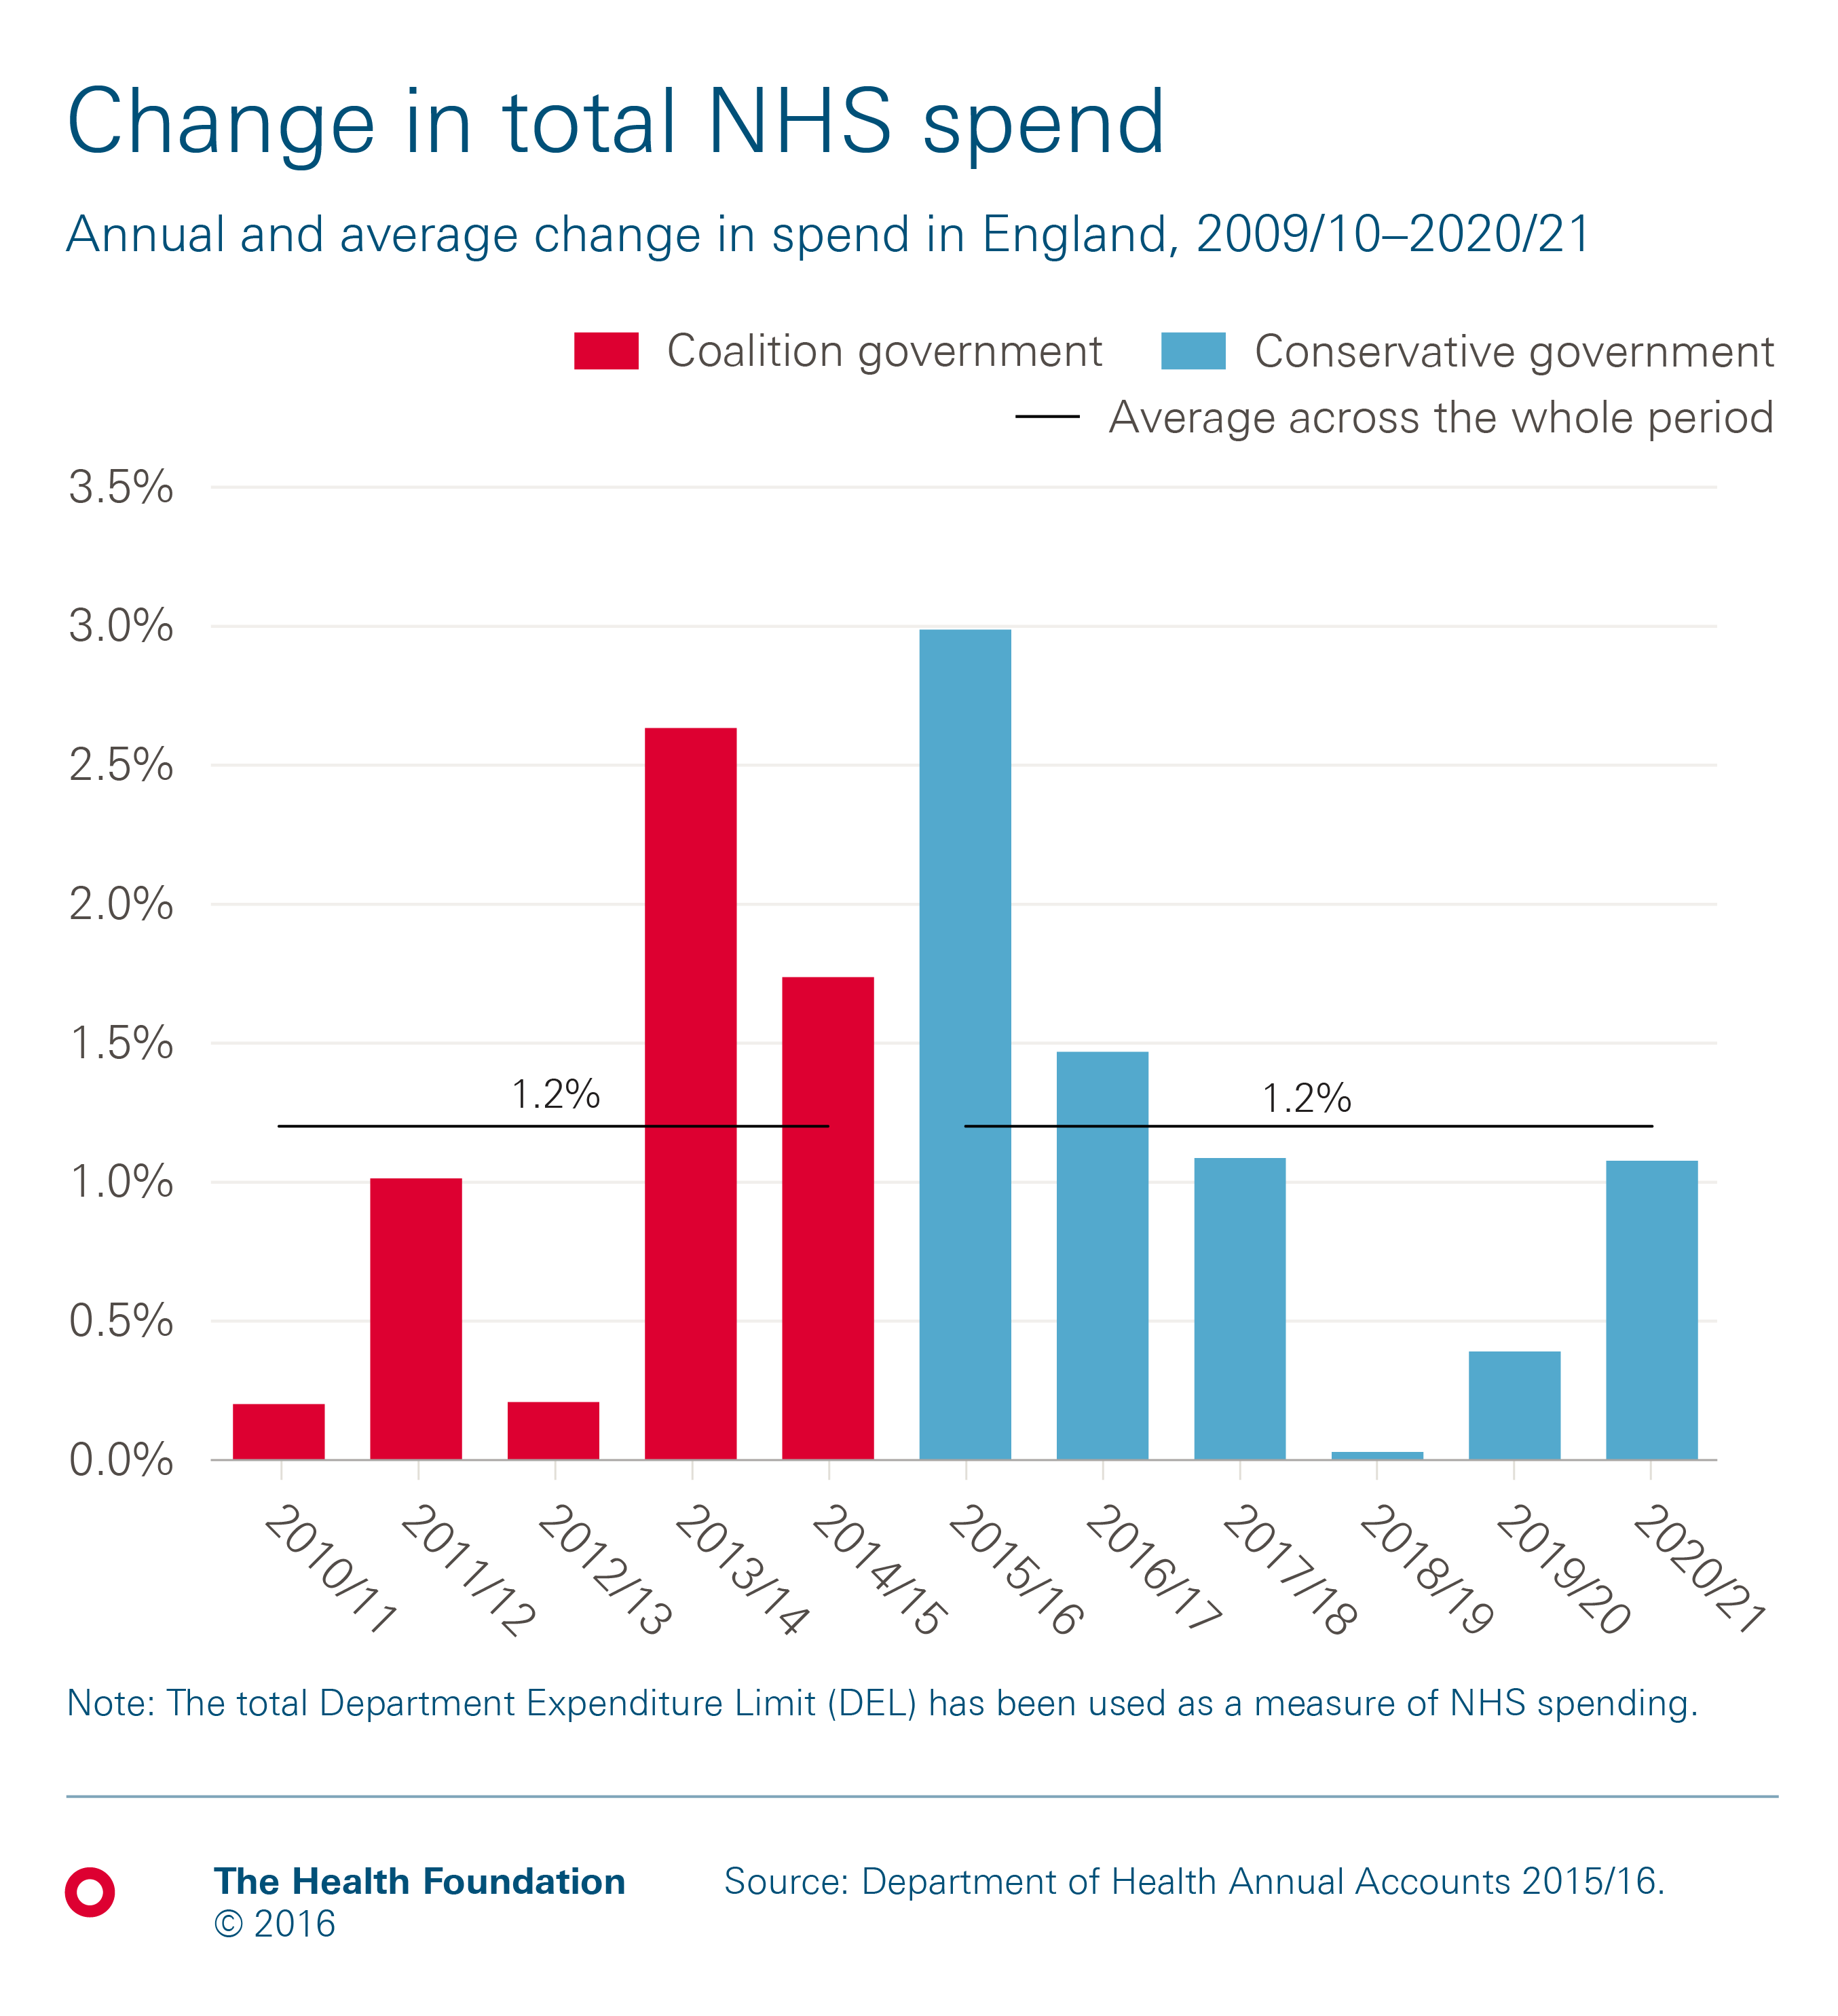
Due to population growth, average NHS spend per head has remained relatively flat under the current and previous governments. Spend per head in England changed from £2,090 in 2009/10 to £2,172 in 2015/16. This is planned to fall to £2,166 in 2020/21, with a planned decrease of 0.7% in 2018/19 and 0.3% in 2019/20.
 What’s happening in social care?
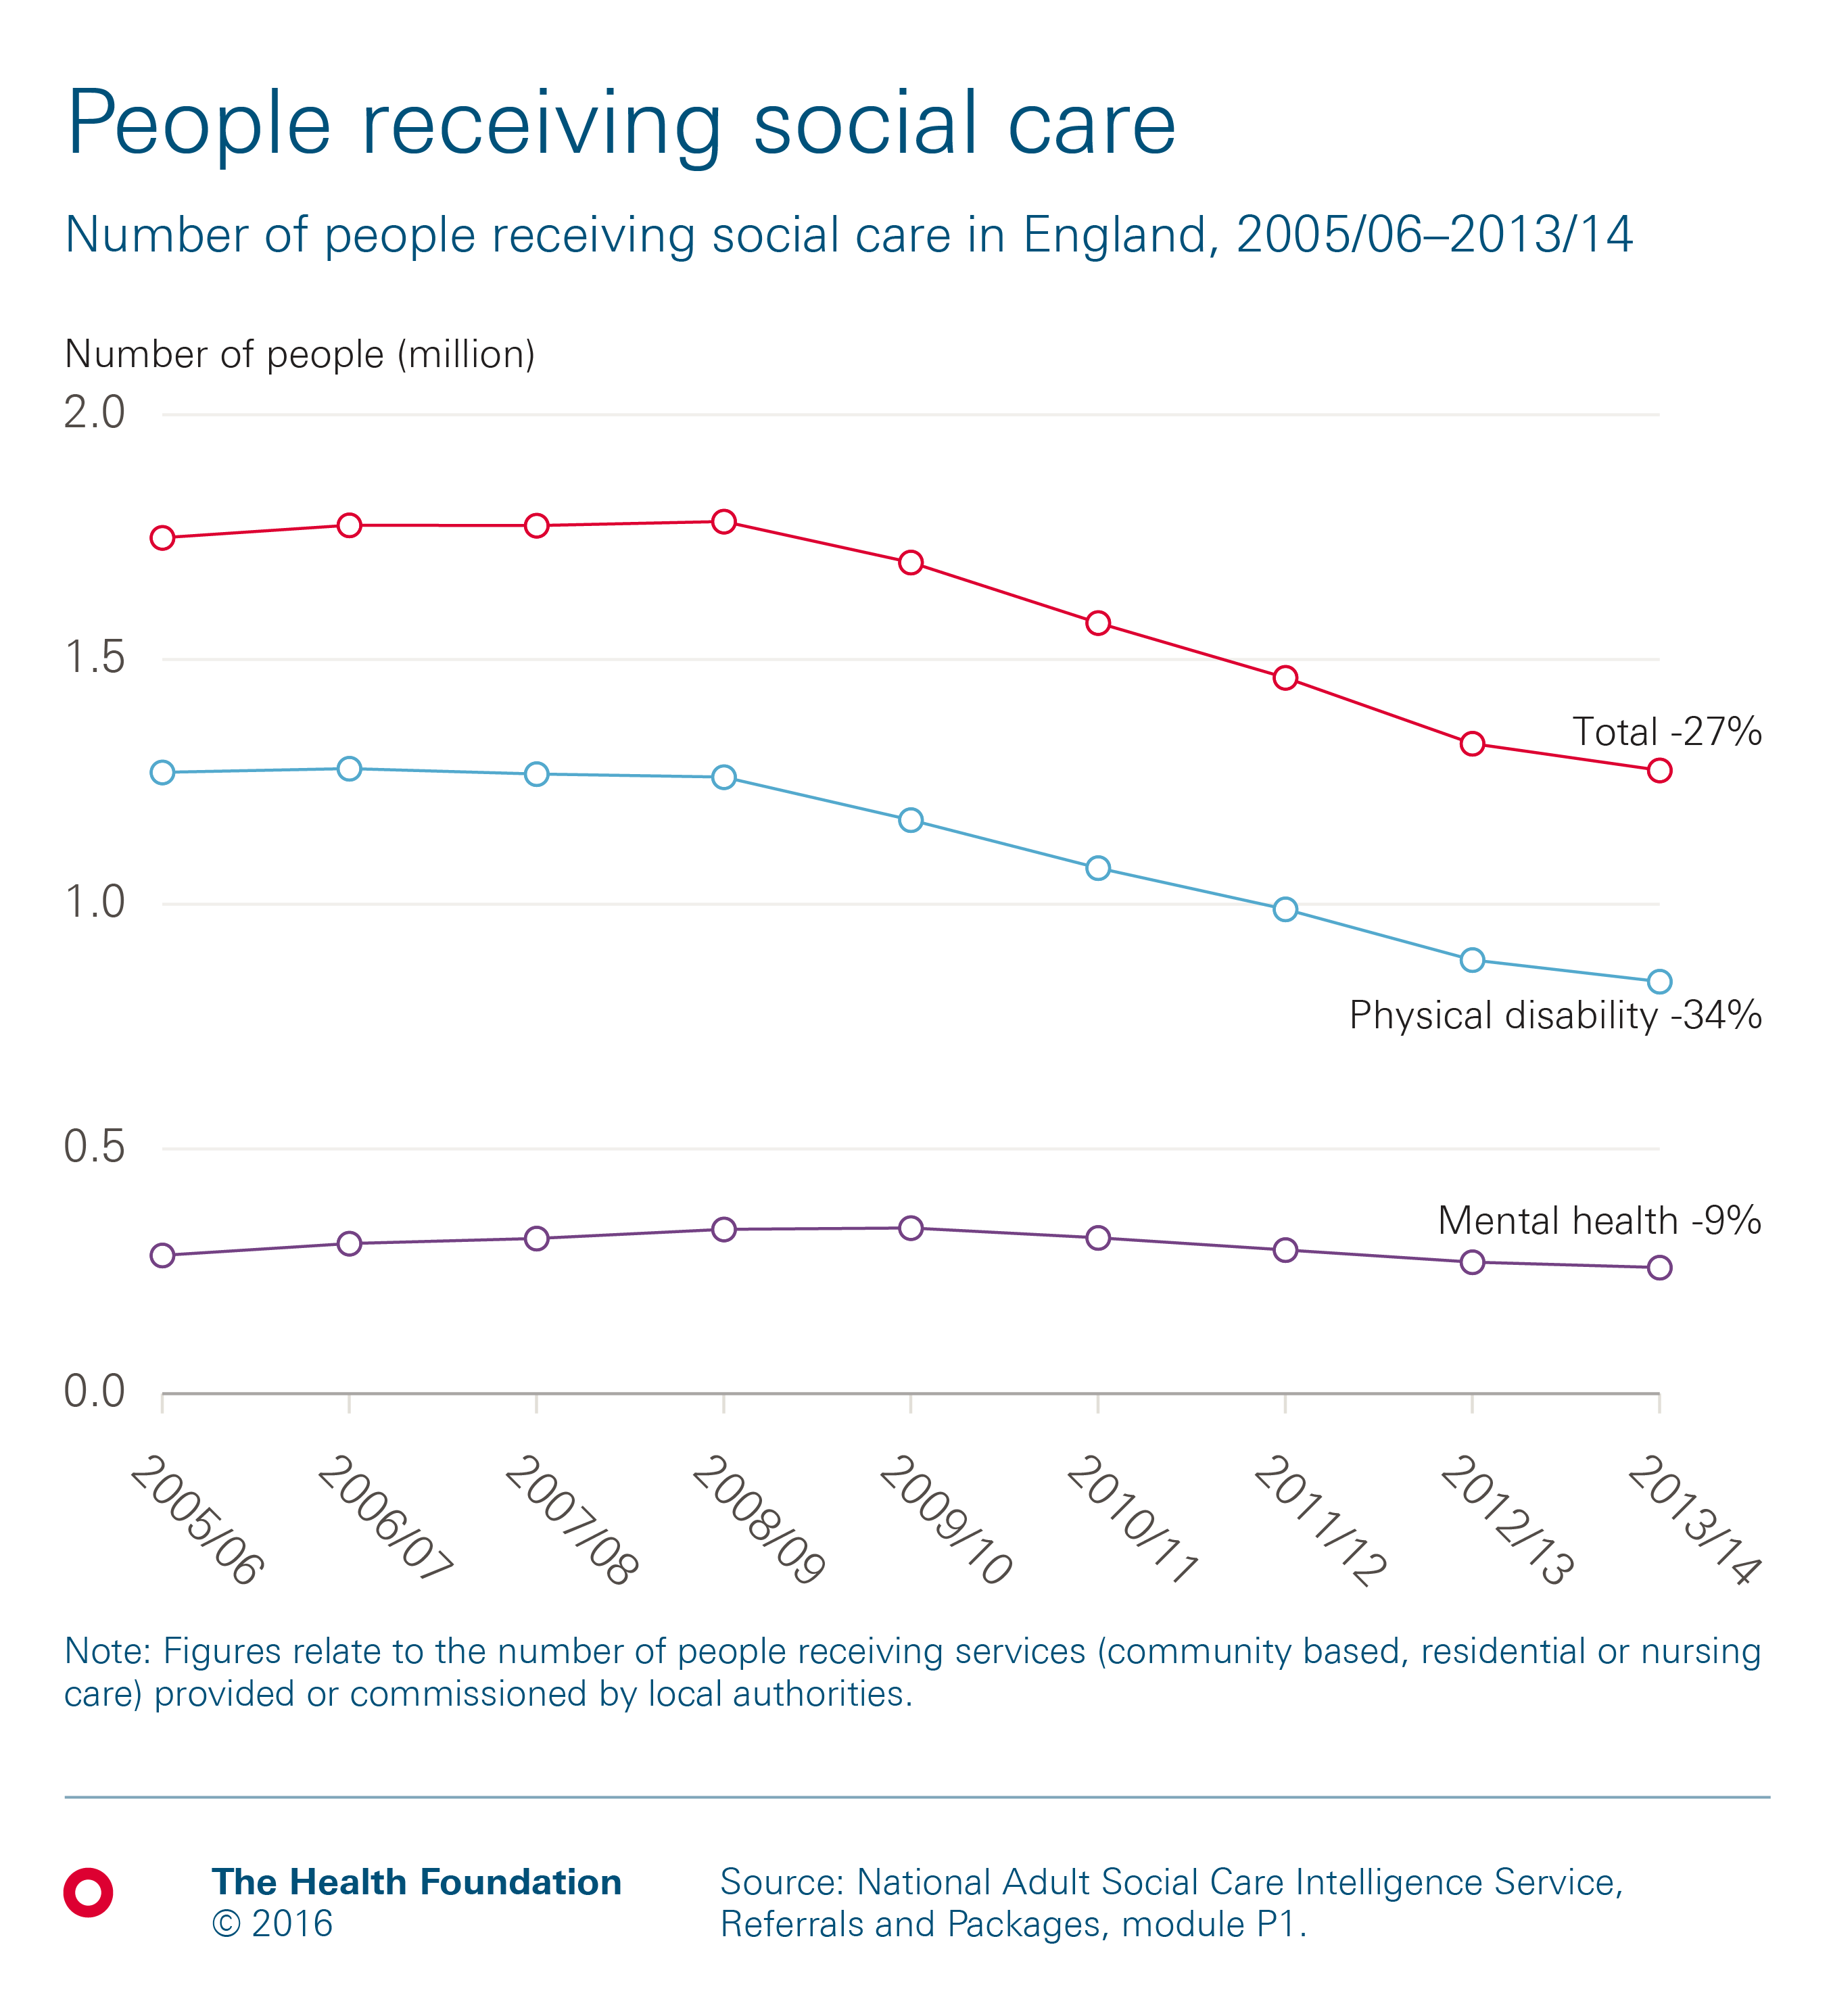
There has been a 27% decrease in the number of people receiving social care since 2005/06. The number of people receiving social services in England (provided or commissioned by local authorities) was 1.3 million in 2013/14, down from a peak of 1.8 million people in 2008/09.
Does everyone who needs social care support receive it?
About a quarter of those over 65 need help with activities of daily living (ADLs), such as eating, bathing and dressing. The gap between people needing and receiving help has a strong income gradient. There is an 8% gap between the percentage of people needing help and receiving it in the highest income bracket and a 23% gap in the lowest.

What does the future look like?
Both health and social care in the UK face a potential funding gap over the next 15 years.
Spending pressures for the NHS across the UK are rising every year, due to a growing and ageing population, rising number of people living with chronic conditions, and increases in the cost of delivering services. The rate at which total cost pressures rise will largely depend on the rate of efficiency growth that the NHS can achieve, and the rate at which pay rises.
Our report, Filling the gap, gives more information on how we’ve calculated the funding gaps in this section.
The NHS
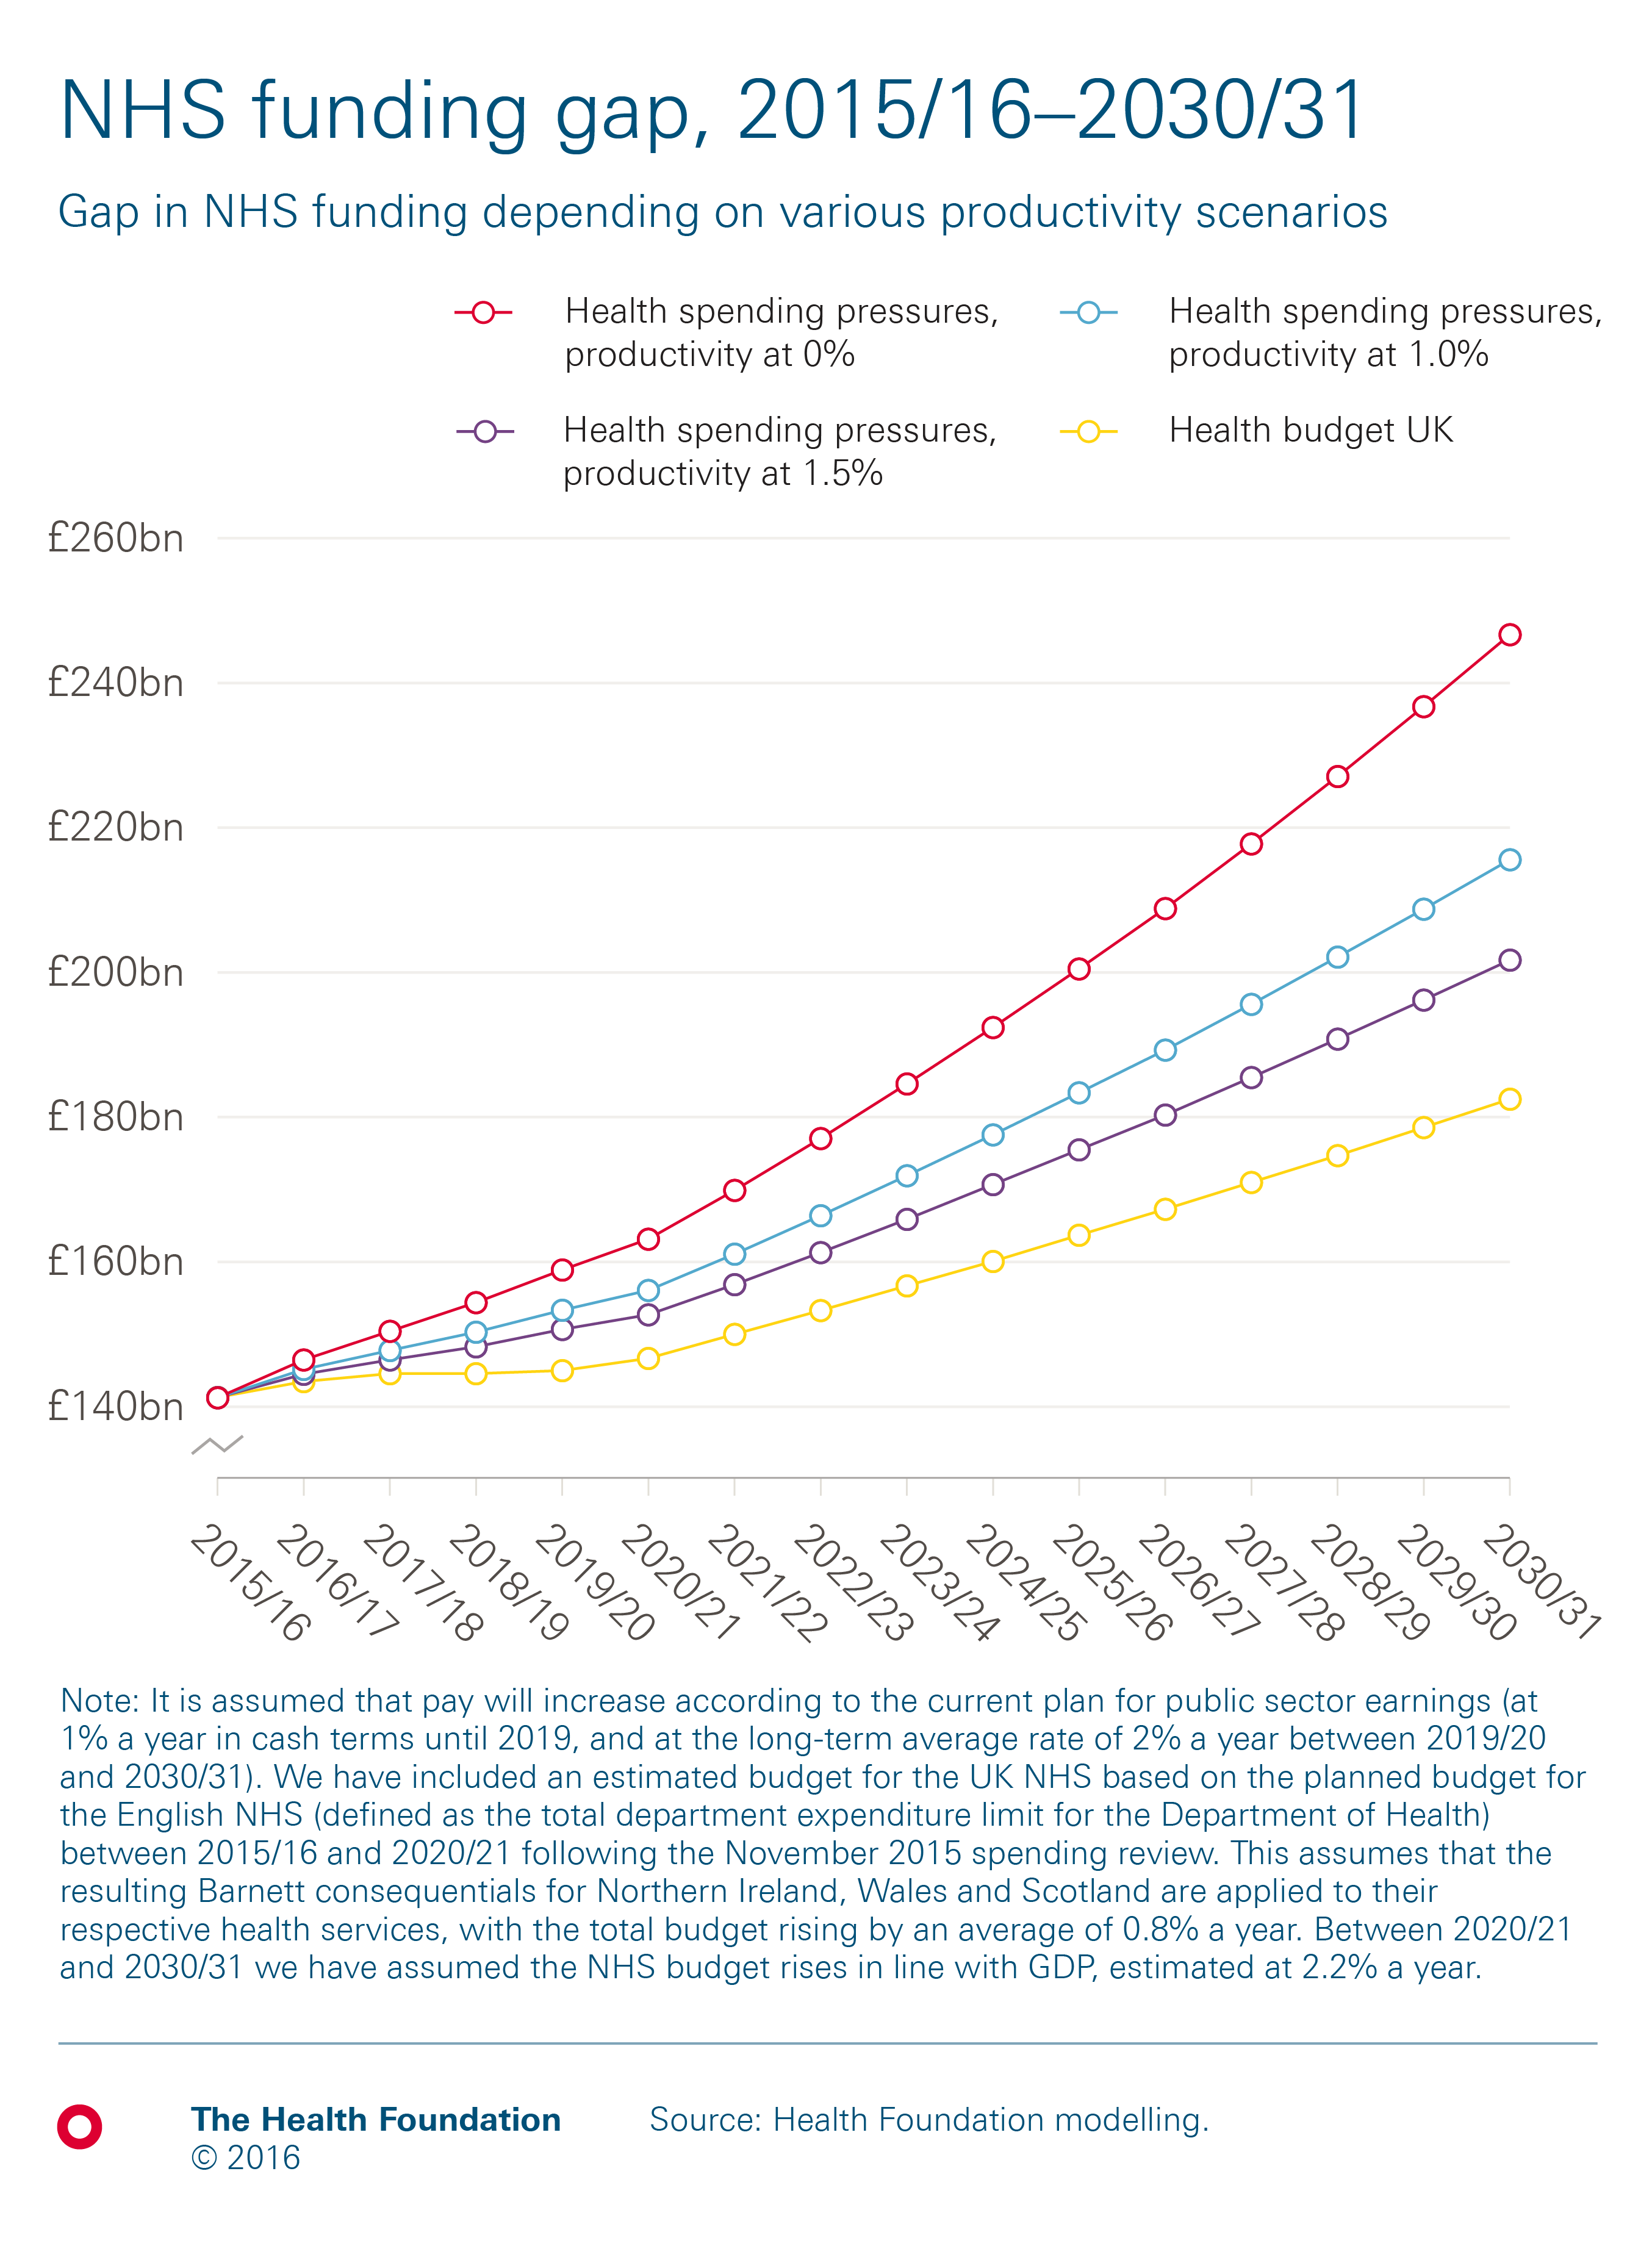
The chart below shows our projections for the rate at which spending on the UK NHS would need to rise over the next 15 years to maintain the quality and range of services provided.
If the NHS achieves no efficiency growth, pressures will rise by an average of 3.8% a year, leaving a funding gap of £64bn by 2030/31. However, if the NHS achieves the long-run rate of productivity growth, 1.0% a year, pressures will rise by 2.9% a year. This would reduce the funding gap to £33bn in 2030/31. If the NHS can increase efficiency to an average of 1.5% a year, the funding gap in 2030/31 would come down to £19bn.
 Adult social care
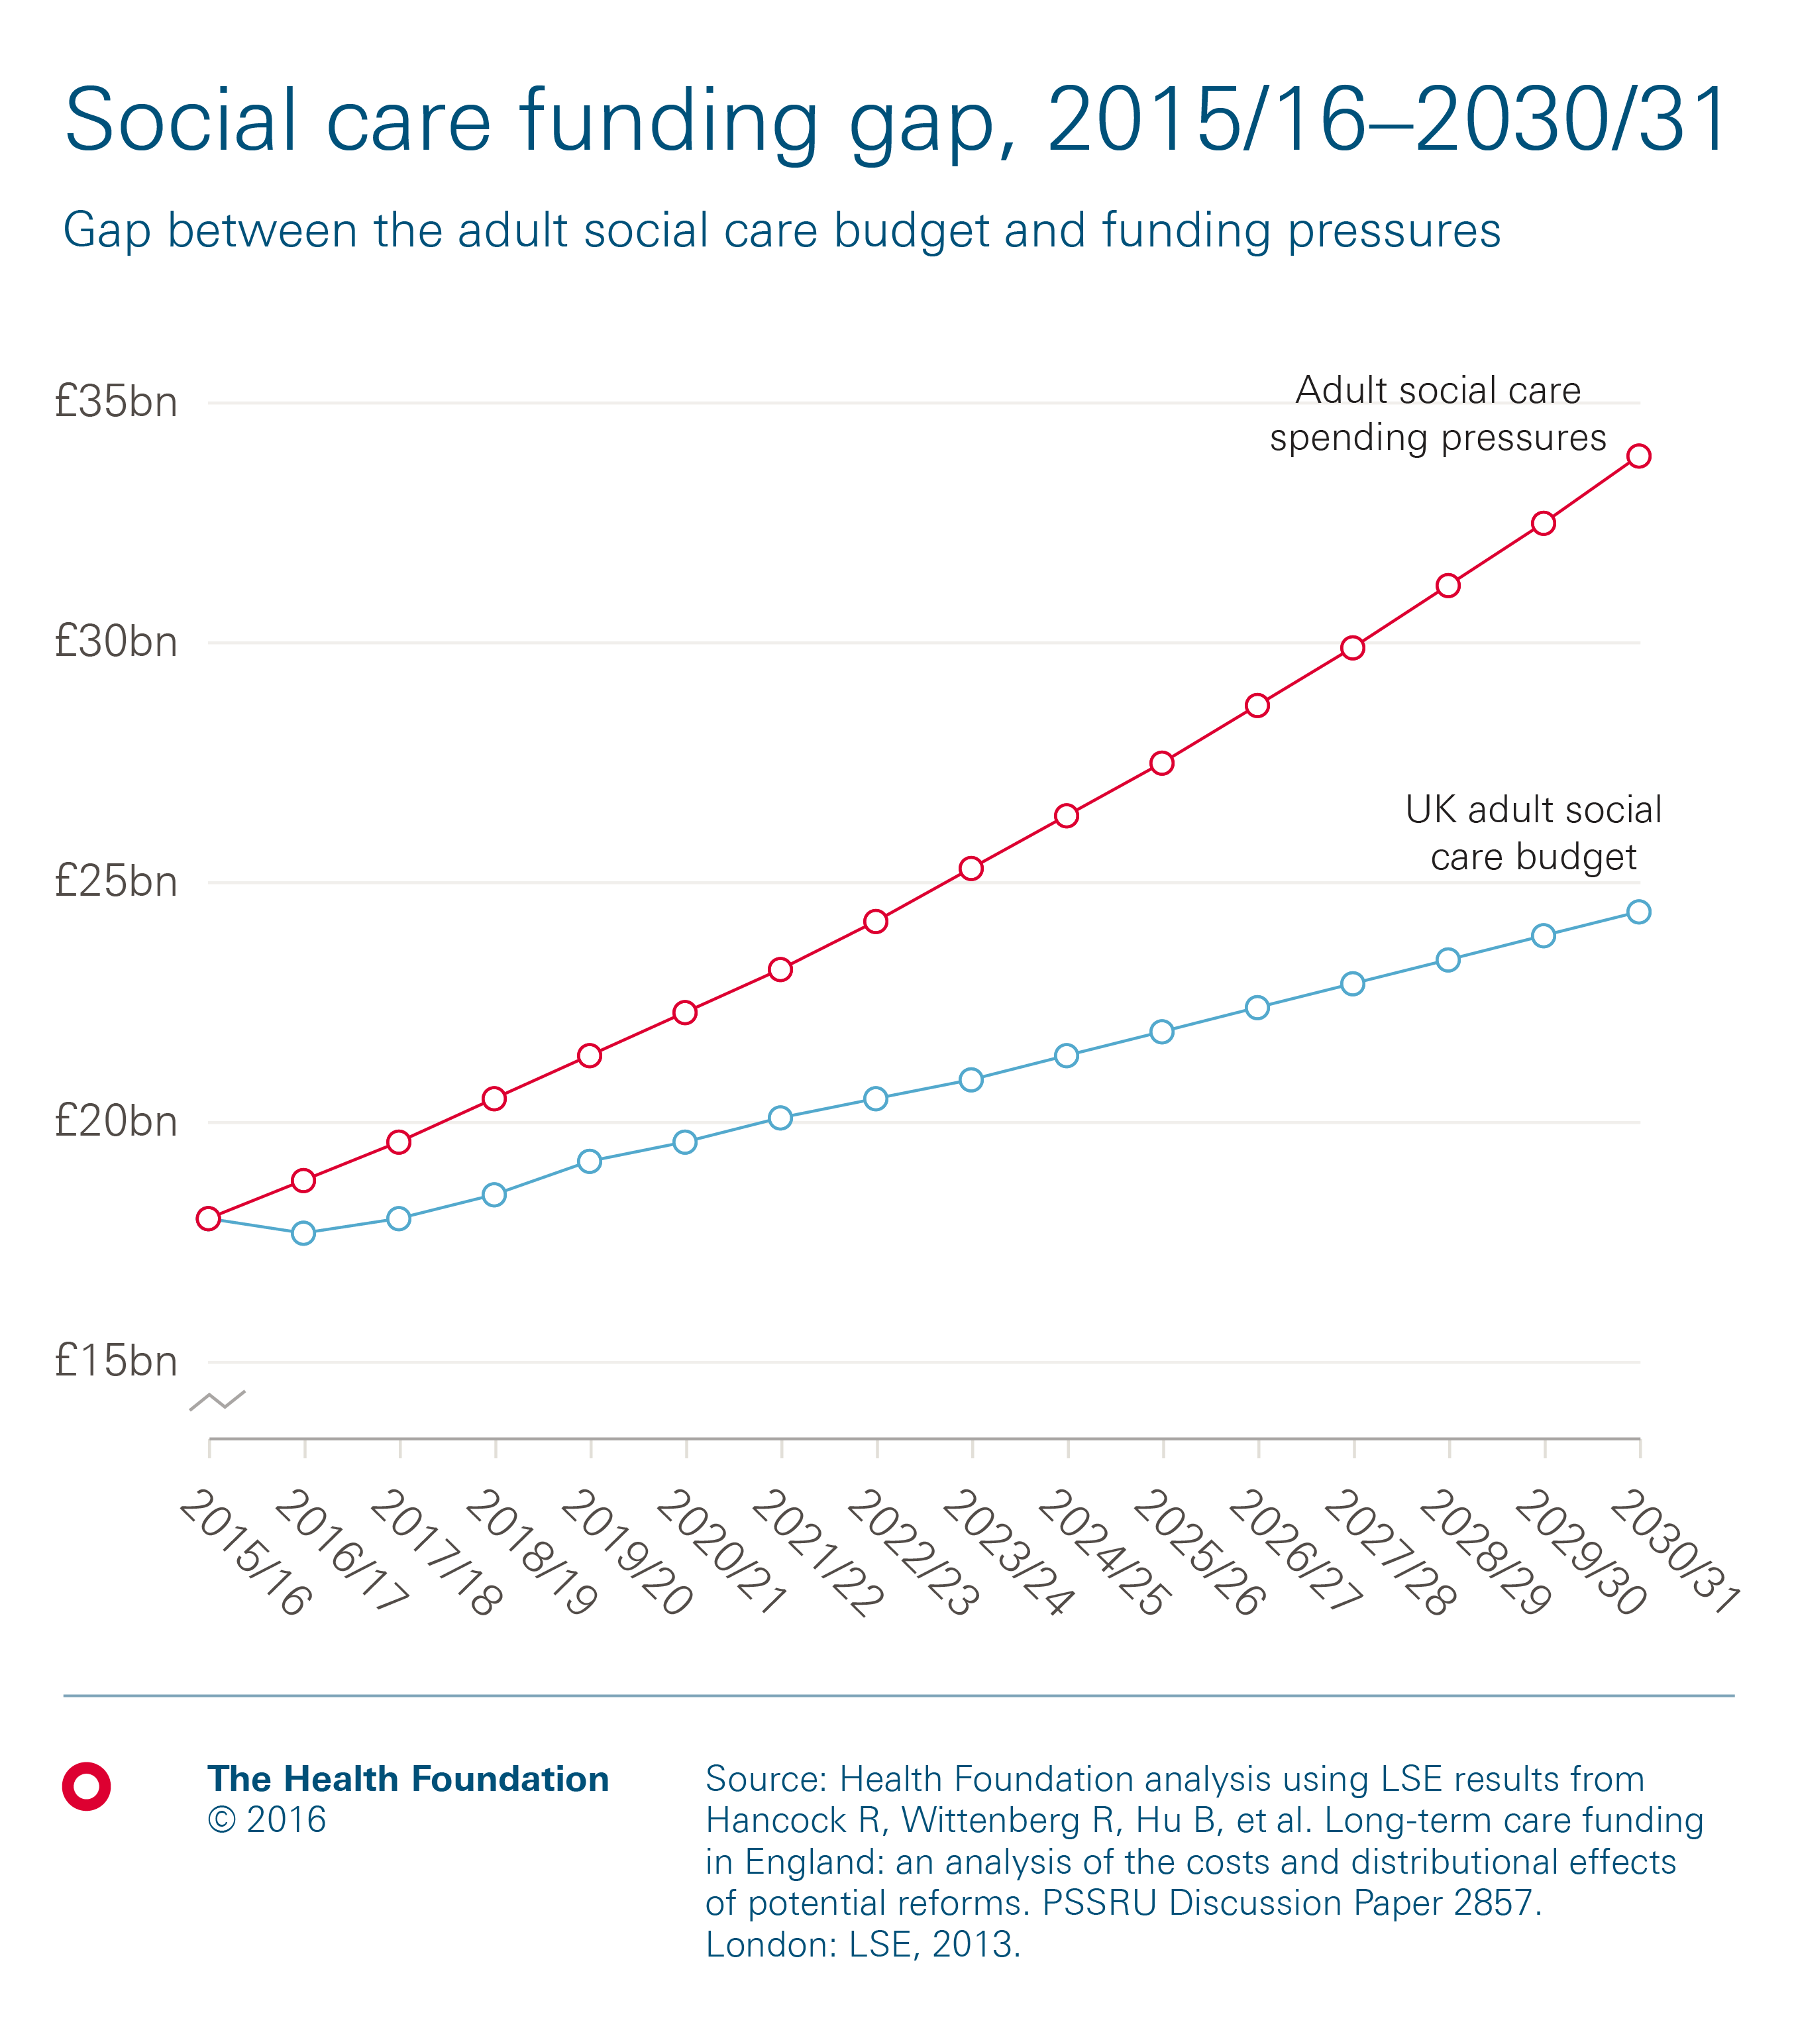
Pressures on publicly funded adult social care are projected to rise by an average of 4.3% a year, using modelling by the London School of Economics. We assume that between 2015/16 and 2019/20, social care funding may rise by an average of 1.6% a year, based on projections for England including funding from the new council tax precept and additional investment through the Better Care Fund. Between 2019/20 and 2030/31 we assume that funding will rise in line with projected growth in GDP.
Under these assumptions, there would be a funding gap of £9.2bn for adult social care in the UK in 2030/31, worth 40% of the projected budget.
 How will health spending change in the long term?
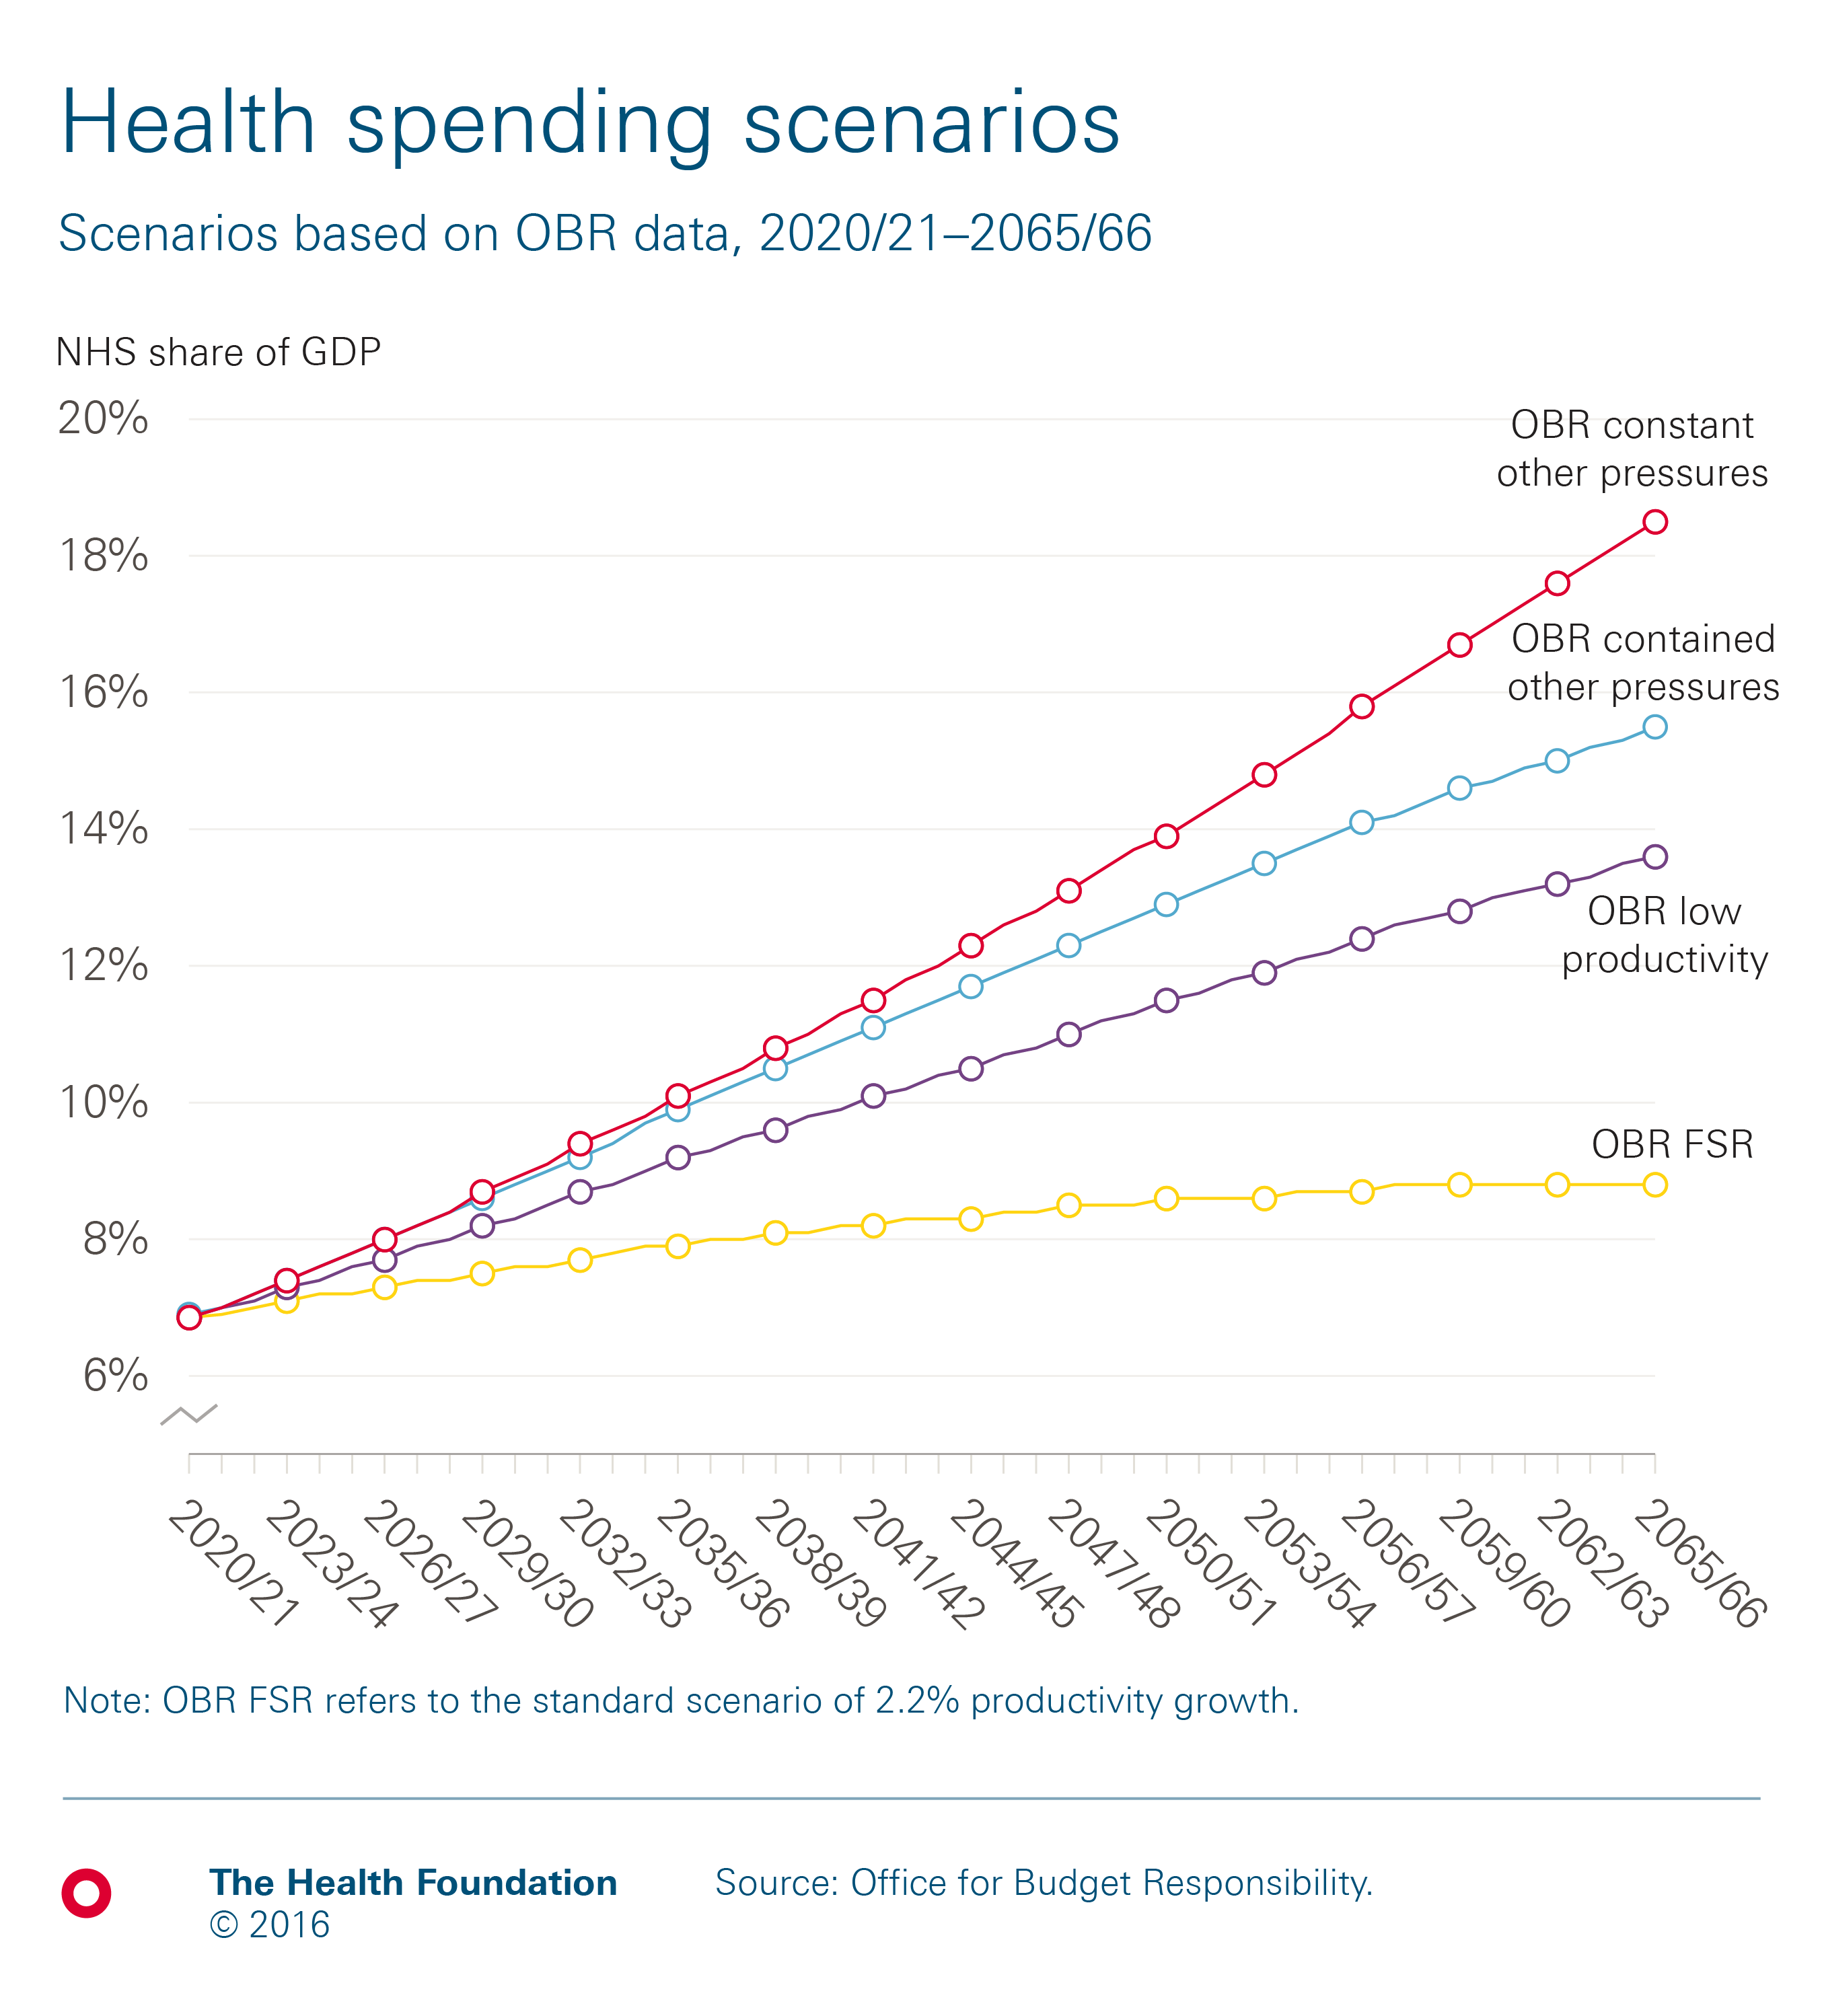
The Office for Budget Responsibility (OBR) is responsible for producing regular projections of the UK’s overall fiscal sustainability, including projections of health spending pressures. Its modelling suggests that health spending for the UK would need to rise to between 8.8% and 13.6% of GDP by 2030/31. The range depends on whether productivity grows in line with whole economy forecast (2.2% a year) or the more likely historical trends in health sector productivity of 0.9%. Either way, this is an increase from the 6.9% of GDP in 2019/20 that is currently planned.
The OBR also takes in to account additional non-demographic cost pressures, predominantly from increasing relative health care costs and advances in technology. In this scenario, the OBR estimates that health spending would need to rise to 18.5% of GDP in 2030/31. However, if there is a form of cost containment over this period the OBR estimates that health spending would only need to rise to 15.5% of GDP in 2030/31.
Definitions of ‘health’ used in this work
Health spending can be defined in a number of ways and, as a result, there are many ways to measure it.
For the purposes of this work
- Health spending in the UK is calculated based on the expenditure on services framework, as supplied in chapters four and five of the Treasury’s Public Expenditure Statistical Analyses 2016 and in accordance with the United Nations’ Classification of the Functions of Government (UN COFOG). Using this measure, public spending by health ‘function’ includes all spending on the NHS in the UK, but excludes administrative costs. It also includes medical research, devolved administrations and local government spending on health. The advantage of using this definition is that there are long run series available for public sector spending on services by function.
- The OECD definition of health as been used for international comparison which defines health as all activities with the primary purpose of improving, maintaining and preventing the deterioration of the health status of persons and mitigating the consequences of ill-health through the application of qualified health knowledge [medical, paramedical and nursing knowledge, including technology, and traditional, complementary and alternative medicine
- NHS spending is defined by the economic function ‘health’ and measured in relation to the total Department Expenditure Limit (DEL). All real terms figures are based on 2016/17 prices, unless otherwise stated.
Further reading
Work with us
We look for talented and passionate individuals as everyone at the Health Foundation has an important role to play.
View current vacanciesThe Q community
Q is an initiative connecting people with improvement expertise across the UK.
Find out more
