Narrowing the gap between our data shadow and reality
19 June 2015

Each day travelling into the office, I join the ranks of people taking the bus, tube, train, cycling or walking into central London. Many of us create a trail of data in our wake; beautifully visualised by researchers at CASA. Big Data - like that held by Transport for London - allows us to understand how people move around the city, predict demand for services and improve the transport service, learning with the data.
When looking at the pulsating map of the city in the above clip, I’m conscious that big data like this, while incredibly useful, captures only one small part of my life. From looking at my travel data an analyst will be able to know what train I chose to take on a given day, but they won’t know why I made that choice. Importantly, on days when I walk or cycle, this transport data won’t have any record of my movements, I’m simply not recorded.
In much the same way, big data in health care suffers from important knowledge gaps. If we created a visualisation of admissions to London’s A&E departments, we could see some patterns in their usage over a week or a year.
We would expect A&Es to pulse with activity over the winter period and perhaps at certain weekends. For an individual patient, while we might be able to see that some people visit the A&E department more often than others and what they were treated for on admission, this data alone wouldn’t allow us to fully understand why they sought treatment through A&E. This makes it more difficult to understand what interventions might help prevent A&E attendance in certain patient groups.
Just as seeing a shadow of an object on a wall would not allow you to fully understand it, there is an important gap between the lived experience each person has and the ‘data shadow’ they create as they pass through the health system, visualised in the diagram below, taken from our review in BMJ Quality and Safety.
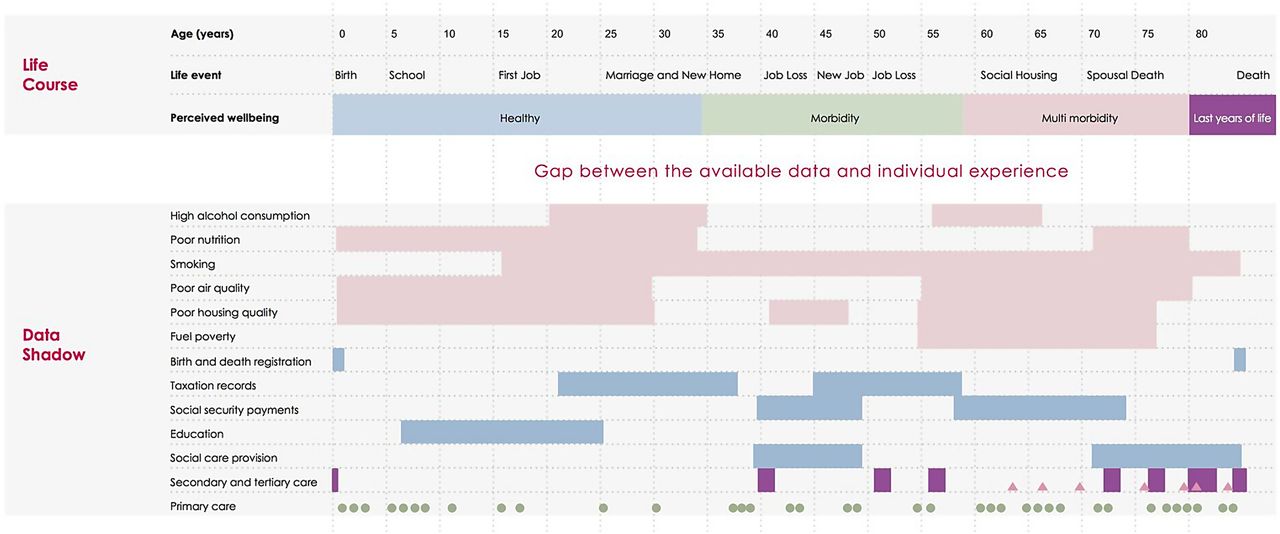
While a number of different health and social care datasets record information on an individual - and we may be able to fill in some gaps in our knowledge through linking with other education and employment datasets for example - there will always be a gap between what’s recorded and what are important events in a person’s life. If we want our health system to learn through data, it’s really important that we don’t mistake these ‘data shadows’ for reality.
In the data analytics team at the Health Foundation we are enthusiastic about the potential of routine data to help us understand the health of the population and improve how we deliver care. However, we believe that the majority of the challenges in using routine data in health care come from not accounting for this gap.
In our review, as well as discussing the challenges, we outline a number of examples where routine health data has been used with some success. One example is the Birmingham Own Health study of telephone health coaching, where patients living with a long-term condition received a regular series of phone calls from a health professional to promote healthy behaviors. The authors assessed whether this intervention prevented emergency hospital admissions. The study was able to link data sets from primary and secondary care and tracked the health and hospital attendance of 2,698 participants over time. When compared to a control group selected from patients in other areas of England with matching health records, they found that the telephone health coaching did not reduce emergency hospital admissions; in fact they seemed to increase.
The Birmingham study shows that routine data have many benefits. We can collect data on a wide cross-section of the population and follow participants in the study over a long period of time. This study was the first large enough to calculate the impact of the intervention on hospital usage and associated costs for a telephone health coaching intervention in England. It also showed that it is possible to overcome and account for some of the limitations of routine data through linking multiple datasets and statistical techniques.
Despite the massive individual level dataset available to the study, we still can’t really interpret the main finding - that telephone coaching was associated with an increase in emergency hospital admissions - though this in itself is useful. We don’t know whether health coaching identified a real unmet need for hospital admissions, or encouraged hospital admissions through some unidentified mechanism. Perhaps being encouraged to observe their symptoms primed the patient to be more aware of their condition and seek medical attention, which they could only access through emergency admission to hospital.
To discover the answer we need further information on the patient’s preferences around their care, existing access to social and clinical support, and factors such as family, and community, to name a few. Supplementing big health data with this other information should allow us to better understand the person behind the ‘data shadow’ and account for this in any analysis.
Harnessing data has the potential to shine a light on areas for improvement in the NHS, allowing the health system to learn and adapt to changing needs. Our paper suggests steps needed to create a learning health system. Understanding the distance between a patient’s ‘data shadow’ and reality is an important first step towards this goal.
Work with us
We look for talented and passionate individuals as everyone at the Health Foundation has an important role to play.
View current vacanciesThe Q community
Q is an initiative connecting people with improvement expertise across the UK.
Find out more
