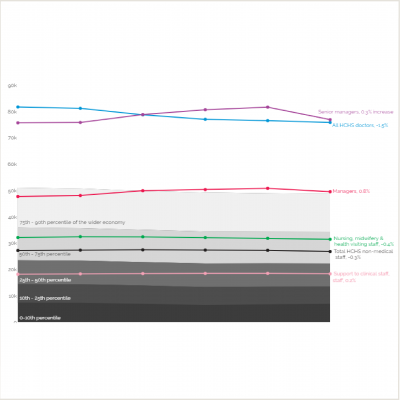
Change in annual earning per person from 2008/09 to 2013/14, real terms, for the wider economy and NHS staff
17 June 2015

- Between 2008/09 and 2013/14, the average earning of the UK workforce has fallen in real terms, but the annual earning of a doctor has fallen faster (-1.5 % per year) than any other staff group.
- The average earning of nurses has fallen at a slower rate than the median and 75th percentile of the UK workforce.
- The average number of managers and senior managers has fallen at a faster rate than average earning which suggest that total spend on managers has fallen during that period.
NHS employees are generally highly skilled and so earn above average salaries, with some groups towards the very top end of the earnings distribution in the UK.
This charts shows that:
- doctors and senior managers earn above the 90th percentile of the UK workforce
- nurses and non-medical staff earn between the median and the 75th percentile of the UK workforce
- and support staff to clinical staff fall between the median and the 25th percentile.
Following the financial crisis pay in both the public and private sectors has fallen in real terms, and the government has implemented a policy pay restraint across the public sector to tackle the deficit. Consequently, between 2008/09 and 2013/14, the average earnings of the 90th percentile of the UK workforce fell by -0.9% per year in real terms, but the average annual earnings of a doctor have fallen faster (-1.5%).
The number of full time equivalent doctors has risen at a similar rate of 1.7% which suggests that total spend on doctors has remained relatively flat in real terms.
Over the same period, the average earnings of senior managers and managers have increased by 0.3% and 0.8% per year respectively, but the number of full time equivalent managers and senior managers has fallen by 3.8% per year from 2009 to 2014, which suggests that the total spend on managers and senior manager also fell slightly in real terms.
The average earnings of a nurse (£32,000 per person) has fallen by 0.4% per year since 2008/09, while the average earnings of all employees in the 75th percentile fell by 0.9% per year.
Wages below £21,000 per year were protected during the government pay freeze and as a result wages of support to clinical staff (around £18,000 per annum) have remained relatively flat increasing by 0.2% per year in real terms while the median earning of the UK workforce fell by 1.1% per year over that period.
Sources: ONS, Annual Survey of Hours and Earnings 2008 to 2013 and Health; Health and Social Care Information Centre, Provisional NHS Staff Earnings Estimates; and NHS Hospital & Community Health Service (HCHS) monthly workforce statistics
Work with us
We look for talented and passionate individuals as everyone at the Health Foundation has an important role to play.
View current vacanciesThe Q community
Q is an initiative connecting people with improvement expertise across the UK.
Find out more

