Universal Credit during the coronavirus pandemic: changes in the share of working-age recipients by local authority
24 July 2023

Key points
- During the pandemic, there were large increases in the number of the working-age population receiving Universal Credit. The figure almost doubled between February 2020 and February 2021, increasing by 3 million to a total of 5.9 million people.
- By February 2022, this had dropped slightly to 5.5 million, but did not return to pre-pandemic levels.
- Overall, in the last 2 years, the biggest increases in the share of the working-age population who received Universal Credit occurred in London boroughs.
Money and resources can affect health in a number of ways. People need a certain level of income to be able to afford the basics for a healthy life, such as food and quality housing. Higher incomes enable people to have more choice, and this often means they have access to healthier options.
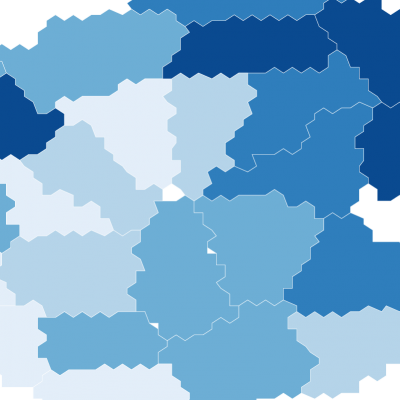
This map shows the change in the proportion of working-age adults in Great Britain claiming Universal Credit between February 2020 and February 2021, and February 2020 and 2022. Universal Credit is a means-tested benefit – entitlement is dependent on household income and specific circumstances, such as number of children and working-age adults aged under 66 years in the household, and level of rent. It is used here as a proxy for the relative scale of financial hardship across Great Britain during the coronavirus (COVID-19) pandemic.
Between February 2020 and February 2021, Great Britain saw large increases in the proportion of working-age adults claiming Universal Credit. In February 2020, 3 million people were receiving Universal Credit and this rose to 5.9 million by February 2021. By February 2022 there were 5.5 million people receiving Universal Credit:
- Compared to February 2020, February 2022 saw a considerable increase in the share of the population claiming Universal Credit, from just under 3% in Richmondshire and Craven, to over 12% in Brent, Haringey and Newham and over 11% in Luton and Barking and Dagenham.
- Most of these areas were already deprived and often had higher concentrations of Universal Credit recipients before the COVID-19 pandemic.
- Between 2021 and 2022, there was a slight reduction in receipt. However, the reduction in receipt between 2021 and 2022 was very small compared to the rise in the year before (February 2020 to February 2021).
Most of the increase in Universal Credit recipients between February 2020 and February 2021 related to people who are not in work, and was due to increases in unemployment. However, there has still been a substantial increase in new recipients who are working: around 1.3 million of the total increase of 3 million recipients over the February 2020 to February 2021 period were in employment.
Between February 2021 and February 2022, the overall number of Universal Credit recipients fell by around 400,000. The fall was greatest in the number of people on Universal Credit who are unemployed.
Increases in financial hardship during the coronavirus pandemic have been concentrated in areas that often already had the most people claiming Universal Credit and highest levels of deprivation before the pandemic. These same areas have a high share of people needing support from Universal Credit during the cost of living crisis, compounding the threat to health from financial hardship. These areas are also often inner-city areas, which are not given a high priority on the government’s ‘levelling up’ agenda.
This map shows the change in the proportion of people aged 65 years and younger who receive Universal Credit as a percentage of the population aged 16–65 years.
Universal Credit is still in an implementation phase where some people may still be receiving legacy benefits, such as Working Tax Credit. Part of the increase in caseload reflects this transition to the new system, but differences in the relative scale of change since 2020 provide an indication of where need is greatest.
Source: Department for Work and Pensions, People on Universal Credit, February 2022: Great Britain, Office for National Statistics, Mid-Year Population Estimates, June 2020: Great Britain


