Key points
- Almost 1 in 8 children are experiencing material deprivation and living in a low-income household (11%), and 4% of children are materially deprived and living in a household with a severely low income.
- 6% of pensioners are experiencing material deprivation.
- The proportion of children living in a household with low or severely low income and experiencing material deprivation has stayed broadly unchanged since before the COVID-19 pandemic (2018/19).
Lacking access to essential items that provide a basic standard of living and level of social participation – such as a warm winter coat, a filling meal, or adequate heating for the home – can directly affect health, independently of income. Material deprivation is much more strongly associated with someone experiencing poor health and lacking resources for an extended period. Time spent without adequate resources has implications for both long-term and short-term health.
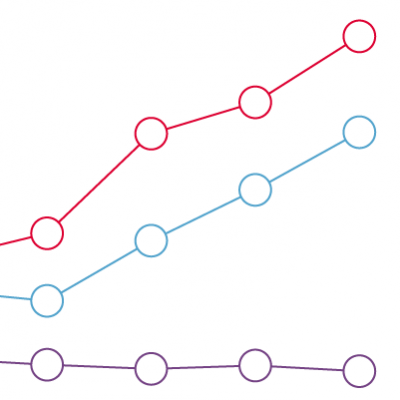
This chart shows the proportion of children identified as being materially deprived and living in a household with either low income or severely low income, and the proportion of pensioners identified as materially deprived in the UK, between 2004/05 and 2021/22.
- The proportion of pensioners experiencing material deprivation has been declining over the past decade: from 8% in 2011/12 to 6% in 2021/22.
- In 2021/22, 4% of children were living in a household with severe low income and were above the material deprivation threshold. This figure is an increase from 3% in 2011/12.
- The share of children living in households with low income and material deprivation has decreased from 12% in 2011/12 to 11% in 2021/22.
The increase in the number of children living in households with severely low income and affected by material deprivation is particularly concerning, given the link between poverty in childhood and worse health outcomes in childhood and adulthood.
Wider poverty measures are crucial to consider in addition to income measures because they capture changes and nuances in the lived experience of people already below the poverty threshold.
- Material deprivation is defined as lacking access to essential items: (1) For children: these items include warm winter coats, leisure equipment, and social participation costs, such as attending school trips; (2) for pensioners: these items include having a filling meal every day, a sufficiently heated home, and being able to attend a social engagement once a month.
- The items are assigned a weighting based on how often they are lacking. Items that more families do not lack are given a higher weighting – if a person lacks an item that most families do not lack it has a higher weight than an item most families also lack. Read more about the methodology.
- For children, the material deprivation measure is combined with a measure of household income. Low income for children is defined as living in a household with a net household income, before housing costs, below 70% of the median. Severe low income is defined as living in a household with a net household income, before housing costs, below 50% of the median.
- The measure of material deprivation for children changed in 2010/11, when four new components were introduced; and again in 2011/12, where the old components were removed. This created a break in the series. Measures for pensioners were available from 2009/10.
- The category ‘pensioner’ is the technical term used in the statistics produced by the Department for Work and Pensions. ‘Pensioner’ is not our preferred wording at the Health Foundation but is accurate to use in this context.
- Data for 2020/21 is not included in line with the Department for Work and Pensions’ guidance related to data quality during the COVID-19 pandemic.
- Figures for 2021/22 data have been affected by the pandemic and are subject to additional uncertainty. They should be viewed with caution and considered alongside longer-term trends.
Source: Health Foundation analysis of Department for Work and Pensions, Households below average income, UK, 2004/05 to 2021/22