- 62% of children and working-age adults in poverty in 2021/22 lived in families where at least one adult was working part-time or more, up from 58% in 2011/12 and 44% in 1996/97.
- 15% of children and working-age adults in poverty in 2021/22 lived in families where all adults were working and at least one adult was working full time (referred to here as high work intensity families), which is the same as in 2011/12 and up from 12% in 2001/02.
Poverty can affect people’s health, as the financial resources people have are not enough to meet their basic living needs, such as adequate heating for their home, appropriate clothing or adequate nutrition. Research shows that although people in poverty living in working families fare better than people out of work in terms of income, material deprivation and financial stress, people in poverty – regardless of work status – fare worse than people not in poverty.
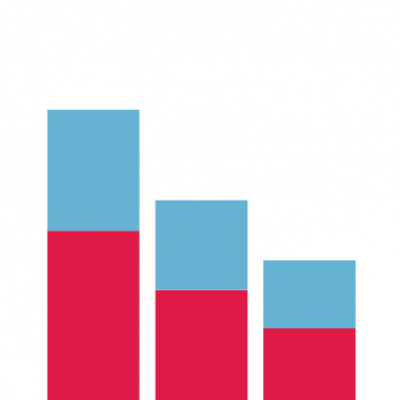
The chart looks at the share of people living in UK households that are in poverty with at least one adult in work, each year since 1996/97. It is divided into higher and lower work intensity families; in higher work intensity families, all adults are working and at least one adult is working full time.
- People in families with high work intensity made up 15.4% of all people in poverty in 2021/22, which is a decrease on the previously available data – 18.8% in 2019/20. This is a similar percentage to a decade earlier – 15.2% in 2011/12 – and it represents a large increase on the proportion in 1996/97 (8.5%).
- People from low work intensity families comprised 46.5% of people living in poverty in 2021/22 – also a decrease on 2019/20 (47.1%). This is higher than the proportion a decade earlier (42.4% in 2011/12) and much higher than the proportion in 1996/97 (35.4%).
There are a number of explanations for the growth of in-work poverty over the last two decades. Partly, this trend reflects the fact that a higher proportion of families have a family member in work compared to in the past. However, there is an increased risk of being in poverty when people are in work, reflecting the growth in housing costs for working families and the faster growth of pensioner incomes, which has raised the overall median (increasing the income required to be above the poverty threshold).
- An individual is classified as being in poverty if they are living in a household with a net household income below 60% of the median in that year.
- Income is equivalised, which means it is adjusted for household size to reflect economies of scale: for example, a household of four needs more income for the same standard of living as a household of one, but not four times as much.
- Housing costs are deducted from income, to reflect that people with lower incomes in particular have fewer options for meeting their housing costs, relative to their income.
- Lower work intensity families are those where an adult is self-employed, only one adult works full time and the other adult does not work, or those families where adults only work part time. Higher work intensity families are those where every adult works, with at least one adult working full time.
- The category ‘pensioner’ is the technical term used in the statistics produced by the Department for Work and Pensions. ‘Pensioner’ is not our preferred wording at the Health Foundation but is accurate to use in this context.
- Data for 2020/21 are not included in line with the Department for Work and Pensions’ guidance related to data quality during the COVID-19 pandemic.
- Figures for 2021/22 data have been affected by the coronavirus pandemic and are subject to additional uncertainty. They should be viewed with caution and considered alongside longer-term trends.
Source: Health Foundation analysis of Department for Work and Pensions, Households Below Average Income, UK, 1996/97 to 2021/22