Living in poverty was bad for your health long before COVID-19
Living in poverty was bad for your health long before COVID-19
25 July 2020
- Adam Tinson

Key points
- Income is associated with health: people in the bottom 40% of the income distribution are almost twice as likely to report poor health than those in the top 20%. Poverty in particular is associated with worse health outcomes. This is especially the case for persistent poverty.
- Income and health can both affect each other – lower income is associated with more ‘stressors’ which can harm health and allow fewer opportunities for good health. Poor health can limit the opportunity for good and stable employment and so affect income.
- The UK entered the coronavirus (COVID-19) pandemic and related economic shock from a starting position of stagnant income growth and low levels of financial resilience. 65% of families in the bottom income quintile had either no savings or savings below £1,500.
- The pattern of employment loss and furloughing by income suggests that the future economic consequences of COVID-19 may be borne by those on lower incomes. This in turn risks an additional long-run burden on health.
- Providing support to bolster people’s incomes for as long as necessary should remain a priority. But there are gaps in the government’s current package of support that risk undermining public health, including the need for more reassurance for renters, retraining support for people who have lost their jobs, and more comprehensive statutory sick pay.
- The government’s ‘levelling up’ agenda must include investment to improve the health of the whole population and level up health outcomes.
To explore our full analysis of how money and resources affect health, visit our What drives health inequalities? evidence hub.
Introduction
When we learned the fatality rate for COVID-19 was far higher among people from more socioeconomically deprived areas, there was rightly a sense of outrage. Mitigating the impact of COVID-19 on deprived communities should be a key concern for government and health care leaders. But the unequal impact should not have come as a surprise.
Not everyone has the same opportunity to live a healthy life, and one key driver for these health inequalities are the inequalities in society itself. The story is not new. But COVID-19 has thrown it into sharper focus.
This long read looks at the link between health and income. It explores the nature of the economic shocks experienced in recent years, including those stemming from COVID-19, and the consequences these might have on people’s health. It then considers how we might use the current crisis to build a fairer and healthier society.
Context
COVID-19 is a novel disease that has required unprecedented measures to protect public health. But the inequalities it has highlighted are far from unprecedented. In February 2020, the Marmot Review 10 Years On charted the growth in the life expectancy gap over the last decade between the most and least deprived amid the backdrop of recovery from the great recession and subsequent austerity measures.
While employment rates had recovered since 2008 and were high in the run up to the pandemic, the quality of employment had not seen striking improvements. Incomes, particularly for working-age families, had stagnated. Average annual household income growth at the median was only 0.4% in the 2010s – compared to 2.0% in the 2000s and 3.4% in the 1990s. By 2019, nearly two-thirds of families (65%) in the bottom quintile for income had savings of less than £1,500, compared to just 18% of those in the highest income bracket.
This was a poor starting point for a society about to endure an unprecedented economic shock. The pandemic and lockdown have since reflected and contributed to social inequalities in various ways (as discussed in more detail in our recent long read).
There have been considerable hits to employment and earnings due to COVID-19 and the lockdown. But the impacts by income are more complicated, as we will explore, and there may be longer term consequences relevant for income – from employment loss to if and how the increase in national debt will be addressed. A review of evidence found the Great Recession in 2007–2009 was associated with deteriorations in self-rated health, morbidity, and psychological distress, but that some of these consequences could be mediated by strong social protection. Thus, both the unfolding economic crisis and the response matter for the long-term impact on health.
What is the link between income and health?
There is a well-established link between income and variations in health. Socioeconomic analysis of mortality finds evidence of this going back to at least the 17th century. These inequalities have persisted in some form ever since, and likely before.
Figure 1 looks at the relationship between self-rated health of individuals and their household income, after housing costs. Self-rated health – where people are asked to assess their overall health – is a good proxy for health outcomes generally. The blue stacked columns show a clear gradient (by income decile) in the proportion of those who report their health as ‘less than good’. This ranges from around one-third of adults in the bottom quintile for income to around 10% for the top quintile. This gradient is even sharper for those rating their health as ‘bad’ or ‘very bad’. Overall, people in the bottom 40% are almost twice as likely to report poor health as those in the top 20%.
It is not simply the case that those in poverty – defined as lacking the resources sufficient to meet needs – have worse health than everyone else. In this chart, the typical measure of poverty corresponds to roughly the bottom two deciles of income. Health is worse in these groups than in any other part of the distribution. But across the distribution, health is better at higher levels of income. Health is better in the tenth decile than in the eighth and is likely to improve within the top decile too.
Figure 1
This relationship holds across England geographically, although there is considerable variation given the importance of other factors and variation in local authorities. Figure 2 shows English local authorities by each area’s average healthy life expectancy for men and average annual household income. Areas with a higher average income tend to have higher average healthy life expectancy for men – the number of years men can expect to live in good health. An increase of around £1,000 in an area’s average income is associated with 0.5 years of additional good health in men.
One interesting dimension of Figure 2 is that it can almost be divided into two distinct distributions: a steeper curve for the north of England and the Midlands, with a shallower curve for the south of England, suggesting a higher level of healthy life expectancy for a given income in the Midlands and north of England. This may reflect actual disposable income. For example, the chart does not capture the higher housing costs in the south. But it may also indicate the eventual diminishing returns to health from higher incomes commonly found when making international comparisons – increases in income matter for health when income is lower more than when it is higher. This is important as there are few southern local authorities in the same quadrants on the chart as northern authorities.
Figure 2
Figure 2 also highlights the geographic spread of inequalities in England. The bottom-left quadrant (which comprises those areas with below-average healthy life expectancy and below-average incomes) is populated largely by local authorities in the north of England. Conversely, the opposite quadrant (with above-average healthy life expectancy and above-average incomes) is almost exclusively populated by local authorities in the south of England.
The north-south divide in health outcomes has clear pertinence for a government whose majority was paved through northern constituencies and that won its election on a manifesto promising to ‘level up’ and spread opportunity across the whole country. Figure 2 shows constituencies (rather than local authorities) according to whether they changed hands in the general election in December 2019. The seats that swung from Labour to Conservative are largely located in the bottom-left quadrant (lower-average incomes and lower-than-average healthy life expectancy). Any levelling-up agenda would need to include investing in the health of those populations.
What causes the link between income and health?
Health and income do not have a straightforward relationship. Each can affect the other over different time periods, and in different ways. Both are also associated with other factors that can influence health. For example, income is related to the quality of housing, work, and education. Leaving these aside, Figure 3 presents some mechanisms by which income and health can influence each other.
Figure 3
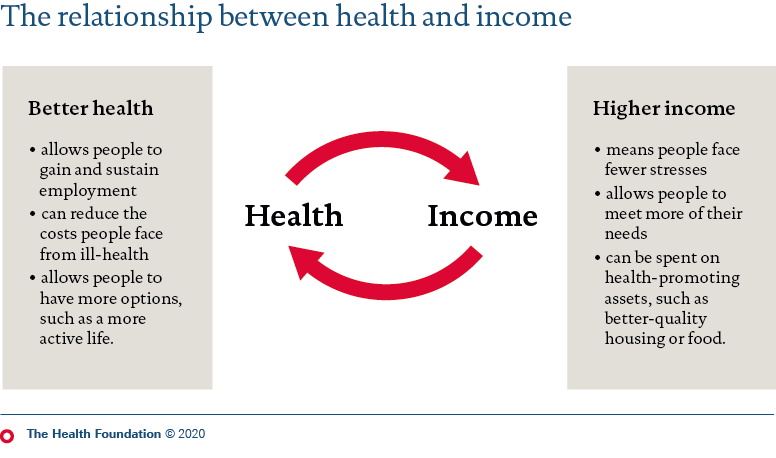
How income affects health
Income has direct and indirect consequences for health. The more income you have (all else being equal), the fewer stresses you are likely to face and accumulate over time. Stresses can contribute to the build-up of psychosocial problems over time, which can manifest physiologically as ‘allostatic load’, as stress responses wear down the body’s systems. These stresses – the ‘hardships, demands, conflicts, and frustrations’ of life – are amplified by living on a lower income.
Income can also affect health through enabling access to more health-promoting goods and services. People on higher incomes can afford higher quality food or better housing, in areas with plenty of facilities and green spaces. They may also have less reason to resort to unhealthy coping behaviours, such as smoking or excess drinking.
How health affects income
Just as income affects health, health affects income. Aside from its inherent worth, health is an asset that produces social and economic value. Poor health can prevent people from gaining or remaining in employment. This, in turn, affects earnings and income (see this IFS research).
Poor health can come with individual costs, too. The social model of disability highlights how living with an impairment in our society requires higher outgoings – both in terms of general costs, such as increased heating bills and additional costs, including medical equipment or care services. These outgoings reduce the amount that people have available to spend. (See Scope research quantifying the costs and NPI research on the impact on poverty.)
There is debate over which of the two factors matters more – health on income, or income on health. But it is difficult to disentangle the two completely, and it is likely each affects the other in different ways and at different points over the course of a person’s life. For example, poor health in childhood is associated with worse outcomes, in terms of health and in terms of economic status, in later life. Similarly, family income at 16 becomes an increasingly important influence on adult health throughout the life course.
Poverty and health
Poverty refers to a situation where a person’s resources are insufficient to meet their needs. The 2020 report, the Marmot Review 10 Years On, highlighted poverty – and child poverty in particular – as a risk to health. As well as the mechanisms above, poverty produces additional stresses from people being unable to meet their needs, including being unable to participate fully in society (social comparison). Poverty may mean people lack access to basic goods or services, such as being unable to consistently heat the home or food insecurity, in ways that can damage health.
Research suggests any exposure to poverty in childhood, compared with no experience of poverty, is associated with worse health outcomes. Persistent poverty is associated with worse outcomes still, for obesity, mental ill health and longstanding illnesses. This is in line with previous research as well. As well as persistence, the number of episodes of poverty ‘accumulated’ over the life course are also associated with worse health outcomes.
Figure 4 illustrates differences in health status by poverty and persistent poverty. The figure defines poverty as having a household income, adjusted for household size, of less than 60% of the median income.
Figure 4
The chart gives the proportion of people in different categories of poverty rating their health as less than good (‘poor’ or ‘fair’), looking at people’s self-rated health according to whether they were in:
- persistent poverty (in poverty in 3 of the last 4 years of data)
- contemporary poverty (in poverty in the current year of data, but not 3 of the previous 4 years)
- not covered by either definition so not in poverty.
People in persistent poverty had the worst health of any of the three groups. Of this group, 30% were in poor health in 2017/18, followed by those in contemporary poverty (25%). Of those who were not in poverty, 15% had poor health. The relative ranking was constant over the time series: those in persistent poverty had worse health than those in contemporary poverty, and they, in turn, had worse health than those who were not in poverty.
How has COVID-19 affected incomes and poverty?
Income statistics are not yet available that can be compared with before the pandemic. However, we can look at trends in income and poverty in recent years and draw on these to establish our starting position as the pandemic and subsequent economic shock started to unfold, and examine what has happened to employment since the pandemic.
Poverty and incomes before the pandemic
Before the pandemic, incomes were growing slowly. There were considerable employment gains, but these were largely in atypical work – part-time, self-employed, or temporary contracts – in the early stages of the recovery from the last recession. The overall impact of strong employment growth on real incomes was also dulled by benefit cuts and higher inflation following the depreciation of sterling after the 2016 Brexit referendum.
Figure 5 reflects these countervailing influences and shows little change in poverty figures over recent years. For example, the proportion of the population living in poverty was 21% in 2010/11 and 22% in 2018/19. Similarly, overall persistent poverty has remained constant over this period.
Figure 5
In contrast to the overall rate, child poverty appears to have risen between 2010/11 to 2015/16 and has since remained at 30% – the same level as in 2009/10. The 2010/11 fall and subsequent rise in child poverty can be misleading on the relative measure. Median incomes fell in 2010/11 in the aftermath of the financial crisis. However, incomes at the bottom were buttressed by social security that was not cut in earnest for a few years. So, the fall in poverty was due to a falling middle, rather than a rising bottom – given the measure of poverty is an income below 60% of the median, it reflects a falling median rather than more incomes growing fastest at the bottom. The health benefits of a temporary fall in this type of inequality were likely to be modest, as were the losses as the inequality bounced back. However, this is not to say that these levels of child poverty are anything other than too high.
The most striking trend has been the fall in pensioner poverty, sustained under Labour and Conservative governments. This offers proof that poverty is a problem treatable through public policy interventions such as the introduction of Pension Credit – which provides a minimum income to pensioners, currently set at £173 per week for a single pensioner.
While overall poverty has remained constant, the situations of those it affects have not. Poverty has shifted towards in-work households and those living in the private rented sector. The impact of these changes in poverty on health deserve more study. There are also elevated risks for different groups that are less new – for example, 43% of single parent families are in poverty on this measure.
Since the pandemic
As yet, there is no data on income to provide a like-for-like comparison before and after the COVID-19 outbreak. Several surveys have shown the impact on employment and earnings, which has been greater for younger adults and people in sectors with lower average earnings (for example, see Resolution Foundation analysis). These employment losses appear to be materialising as higher economic inactivity, rather than unemployment. This is in part due to closed sectors and relaxed benefit conditions meaning people are unable to ‘actively seek work’, though conditionality is now returning.
The impact of employment and earnings loss on household income are muted by social security and lower taxes, and currently, also through the Job Retention Scheme (JRS) and the Self-Employment Income Support Scheme.
Research by Brewer and Tasseva is the first modelled estimate of the impact of the lockdown on incomes so far, finding an average loss of 8% of net income. This is a large drop in incomes, unprecedented in recent times. The analysis finds that the bottom income quintiles have lost less income than higher income groups, as the poorest are less exposed to employment shocks. This is due to lower initial employment and boosts from (temporary) increases in social security rates.
In the short term hardship is likely for many across the income distribution due to job losses or reductions in earnings (although many will also have seen reductions in outgoings). The consequences of these tend to be more severe for lower-income families who spend a greater share of their incomes on essentials, meaning less room to manoeuvre in their budget and fewer, or no, savings to fall back on.
Figure 6 highlights the potential exposure to longer term economic damage by a person’s previous income quintile.
Respondents to the April 2020 wave of the study (which did not contain income data) were linked to their income quintile in 2017/18 – the most recent available data. This method is not perfect, but there is reasonable stability in the income distribution between a small number of years. Between the two most recent waves, 62% of the bottom quintile stayed in the same quintile and a further 23% moved up to the next quintile. This suggests that people’s quintile in 2017/18 is still a reasonable guide to what is happening in April 2020.
Figure 6
Figure 6 shows that unemployment has been greatest for those on the lowest incomes historically. The proportion of people (including employees and the self-employed) who lost their jobs between January/February and April was twice as high for those in the bottom income quintile as for those any other quintile (7.2% compared to 3.2%–3.5%). Employees in lower income quintiles are also more likely to have been placed on furlough as part of the Job Retention Scheme: around 28%, compared to 17% in the top quintile.
This raises the risk of the long-term economic impact unfolding in an unequal manner. These furloughed jobs may be more at risk of disappearing as the scheme unwinds, as discussed recently by the Resolution Foundation. This may mean further job losses in a job market with few vacancies, and the associated longer term consequences of a long spell out of the labour market may be greater at the bottom of the income distribution. Compounding this, the increases in social security benefits at the start of the pandemic are time-limited to only a year.
Deteriorations in people’s financial situations are also indicated through other measures of financial stress, such as:
- a doubling in food parcels distributed by foodbanks and rising food insecurity
- sharp increases in non-payment of bills such as rent and mortgages
- 3 million applications for Universal Credit. (The UKHLS data above also shows that 3.6% of those in employment in January/February had attempted to or made a Universal Credit claim by April, rising to 7.3% for the bottom income quintile.)
What does this mean for health?
The economic consequences of the COVID-19 pandemic, and the associated lockdown, are already having a negative impact on mental health and wellbeing (see also the findings from our recent survey commissioned in partnership with the Resolution Foundation). Will they also have an impact on longer term health outcomes? There is precedent: the 2009 financial crisis and recession was followed by a rise in long-term health problems.
Conclusion
Lower incomes are associated with worse health and this is particularly severe for people living in poverty. The longer someone lives without an adequate income, the worse the risk is to their health. This risk, in turn, can affect that person’s ability to find or sustain work, potentially resulting in a vicious circle of lower wellbeing, reduced productivity and a more limited ability to participate in society.
Income figures from 2018/19 paint a picture of the UK heading towards the COVID-19 outbreak having experienced a decade of disappointing income growth. This weak starting point will have undermined families’ financial resilience as the country entered the pandemic.
The findings shared here present an important framing for the current crisis. They make a strong case for protecting households from the economic consequences of COVID-19 for as long as is needed and again highlight the disadvantage faced by people on lower incomes, who become unwell earlier in life and die younger. These health risks carry with them the possibility of greater costs to the NHS and social care down the line. The distribution of furloughed jobs by income, combined with low levels of job vacancies, hint at future economic costs: prolonged spells away from the labour market can reduce earnings, employment prospects, and increase the need for state support.
This crisis has thrown many social problems into sharp focus, including issues relating to overcrowded homes, structural racism, and how front-line workers are valued. Inequalities have exacerbated the crisis at the same time as the crisis has worsened them. As we move to the next phase of the pandemic, we need to finally address these inequalities in earnest.
Recommendations
Recommendations for the short term
- Some commentators have positioned the public health measures required to limit the spread of COVID-19 in opposition to a return to economic growth. In reality, until consumers and workers can be assured of their safety, the two are dependent on each other. Economic policies must provide the right incentives to protect health, with health protection measures eased when appropriate. An example of this is statutory sick pay – its current low level and gaps in provision can mean financial penalties for those who do the right thing and self-isolate when they have symptoms. Correcting this would realign these incentives.
- Household incomes are likely to continue to deteriorate for some time due to the winding down of the Job Retention Scheme, some sectors only partially opening, and job losses at struggling firms. Policy must reflect this likely mismatch between the demand for jobs and available opportunities. That means ensuring that conditionality in the benefit system is proportionate, with no return to the harsh sanctioning regime of the 2010s that has often left already struggling families with inadequate income. Practical support must also be made available for people to find or retrain for new roles. And efforts should be made to mitigate the knock-on impact of this in terms of reduced finances (for example as a result of enhanced risk of eviction for private renters). An agile winding down of the Job Retention Scheme is also needed, focused on the worst hit sectors and with exceptions for areas experiencing ‘local lockdowns’.
Recommendations for the medium and longer term
- In many ways, what we do now in the face of the economic fallout of the pandemic could lay the basis for a more equitable future. Short-term losses in income should be prevented from becoming long-term in order to minimise the future health risks. One relevant policy here would be to extend the temporary increases in social security as part of a programme of strengthening the benefits system. Policies that incentivise job creation (such as the ‘Kickstart’ jobs scheme) should be coupled with support to retrain and find new high-quality work.
- Whatever fiscal retrenchment takes place after the current crisis, this should not exacerbate income inequalities.
- Polices to support household incomes should provide a framework that reduces the burden of poverty, and therefore the future burden on the nation’s health. Poverty reduction would need a wide-ranging strategy including: increasing genuinely affordable housing options to reduce pressures on family incomes from housing costs; further investment in early years services and child care to support children from the youngest ages; creation of better quality, higher paid work, and fixing the gaps in local welfare provision to protect the most vulnerable.
- The government’s policy agenda focusing on ‘levelling-up’ opportunity across the country is welcome. To ensure this agenda delivers tangible improvements in people’s lives and to bolster the economy longer term, there should be a focus not just on enterprise and productivity-increasing infrastructure, but also on social protection and addressing inequalities in health outcomes between different groups. Sustained action across the wider determinants of health, including action to boost incomes, could be driven forward through a cross-government health inequalities strategy.
Adam Tinson (@adamtinson) is a Senior Analyst at the Health Foundation.
Thanks also to Alex Eastaugh for contributing analysis to this long read.
Further reading
This is part of Evidence hub: What drives health inequalities?
Data, insights and analysis exploring how the circumstances in which we live shape our healthShare this page:
Work with us
We look for talented and passionate individuals as everyone at the Health Foundation has an important role to play.
View current vacanciesThe Q community
Q is an initiative connecting people with improvement expertise across the UK.
Find out more
