Tracking progress on health: keeping it simple
18 March 2022

Making the complex simple is a skill. We all know the power of a soundbite or statistic to grab our attention. Or the power of a picture to influence the national conversation. But despite this, working to improve health often feels far from simple.
There is much to learn from the climate change movement, where in recent years there has been a noticeable shift in public awareness. David Attenborough made an impact with his self-explanatory, sobering pictures of plastic in the ocean in the BBC’s Blue Planet programme. He spoke directly to the public, made it matter to them and people demanded action. There has also been a coalescence around a single vision for climate change: to reach net zero by the middle of the century. This goal is now at the heart of all climate conversations – countries, companies and citizens have united around it. It is a reductionist approach, but its effectiveness can be seen through the momentum and action generated.
So, what can we learn in order to encourage a similar commitment to improving health? The latest version of the Office for National Statistics (ONS) health index for England, released today, provides a mechanism to better understand what drives our health. The principle behind the index is one that underpins all our work: that health is determined by the conditions in which we are born, work and live, including our housing, our education and our access to open spaces.
The ONS health index measures 56 indicators within three domains: healthy people, healthy places and healthy lives. The indicators cover health outcomes such as health conditions, risk factors such as health-related behaviours and personal circumstances, and the wider determinants of health that relate to the places people live. These measures help us understand how health changes over time, at a national and local level, and – importantly – enable us to see what is driving these changes.
The Health Foundation has been making the case for some time for putting health at the heart of decision making, tracking progress on health alongside GDP. The ONS health index and the visualisations show the interconnectedness of health, education, the local environment, crime and a range of other factors. Linking these factors in this way goes beyond existing data on healthy life expectancy. It will give local leaders the evidence behind specific drivers of health, creating a framework for conversation about how local plans are likely to shift these drivers. But its use transcends the local area too: the index provides a common language for communities, local areas, regions and central government to talk about health and how to maximise it.
It will be important to not overload the index and to recognise any limitations. For example, as with all indexes, the combining of multiple measures into a single score risks masking the effect of changes in some indicators. And the ONS health index (like many others) has a considerable time lag, because it has to move at the pace of its slowest indicators. This means the latest data included are for 2019, although an update with 2020 data will follow later this year. There are also some gaps: local-level data aren’t available for some indicators, and not all relevant areas are included – for instance, there are no data on social relationships, which we know are an important driver of health. But even recognising these limitations, the index has the potential to develop the conversation about how to improve health, and this is where its power lies.
We would like to see central government departments using the health index to describe progress and understand the local picture – particularly the Department of Health and Social Care (DHSC) and the Department for Levelling Up, Housing and Communities (DLUHC). We would also like departments to use the index to consider the impact their policies will have on health, prioritising any activity that improves health and rethinking those with a negative impact. Experience suggests that the effectiveness of key metrics in government depends on how much political support they receive. For example, the movement to create, publish and make greater use of measures of wellbeing in the policymaking process was originally championed by David Cameron as Prime Minister. The ONS now regularly publishes a dashboard of measures of wellbeing, and in recent years wellbeing has had greater recognition within the Treasury’s Green Book (the guide to assessing policy choices).
It remains to be seen whether the latest ONS health index becomes the net zero equivalent for addressing health inequalities. It may not be perfect, but it’s currently the best that is on offer – so let’s make the most of it to help join up the conversation on improving health at local, regional and central level.
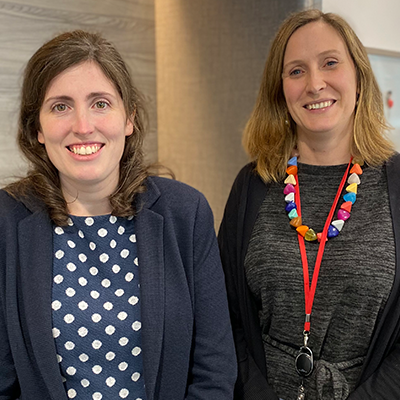
Katherine Merrifield (@KMerrifieldTHF) and Gwen Nightingale (@GNightingaleTHF) are job-share Assistant Directors in the Healthy Lives team at the Health Foundation.
Further reading
Work with us
We look for talented and passionate individuals as everyone at the Health Foundation has an important role to play.
View current vacanciesThe Q community
Q is an initiative connecting people with improvement expertise across the UK.
Find out more

