Is poor health driving a rise in economic inactivity?
10 October 2022
Key points
- Economic inactivity in the UK has increased by around 700,000 people since before the pandemic. This includes 300,000 people aged 50–69 years, who are at greater risk of never returning to work.
- The main reason behind the increase in economic inactivity among 50–69 year olds in Q2 2022 (200,000) was self-reported ill health.
- Of the 3.5 million 50–69 year olds inactive in Q2 2022, 1.6 million reported ill health as their main reason for inactivity. An additional 155,000 reported ill health as a factor in why they were inactive.
- An increase in poor health and economic inactivity is a concern for policymakers because it can restrict labour supply and economic growth. Understanding the drivers and scale of the recent rise in economic inactivity can help shed light on the policy measures needed to boost employment.
- There are several suggested causes for the recent rise in people reporting economic inactivity due to poor health – such as long COVID and long waiting lists for treatment. We conclude that these contributing factors are exacerbating a pre-pandemic trend of the increasing prevalence of poor health, and of poor health as a reason for inactivity.
- Taking a longer view, the number of 50–69-year-old people economically inactive due to ill health was growing gradually before the pandemic and reached 1.7 million in the 3 months to July 2022. In the same period, 3.8 million 50–69 year olds were inactive and reported a long-term health condition.
- Policy interventions should focus on helping those who want to return to suitable work, and overcoming the barriers to work this group may experience. Longer term there is a need for government and business to work together to help keep people in good health and in work in the first place.
Introduction
The increase in economic inactivity since the beginning of the pandemic has generated a lot of comment – from talk of ‘the great resignation’ to ‘the great retirement’, and questions about the role of long COVID and the increase in long-term sickness. Different reasons for this change have been mooted, whether it relates to voluntary retirement or an increase in ill health. This article aims to try and unpick these differing potential causes.
People generally can be categorised into three broad statuses. Those in employment – currently doing paid work in the week; those who are unemployed – actively seeking and available for work, and those who are economically inactive, either not seeking or not available for work, or both. People in this last category include those who are retired, have caring responsibilities, or have health problems that prevent them from working. Here we use ill health to mean where people have reported they are temporarily sick or injured or long-term sick and disabled.
More people becoming economically inactive at older ages is a concern because the likelihood of a return to work is very low. That likelihood becomes lower still when in combination with poor health. An increase in poor health and economic inactivity is a concern for policymakers because it can restrict labour supply and economic growth.
The increase in inactivity is quite modest – taking the UK back to 2018 levels – and not unprecedented following an economic contraction such as that experienced in 2020. However, it is a cause for some concern as it reverses a trend in an otherwise improving post-pandemic labour market. In particular when other indicators – such as unemployment and vacancies – suggest a tight labour market. The rise in inactivity may also be an indicator of declining health.
Economic inactivity in context
Economic inactivity among working-age people (16–64 years) since the start of the pandemic had increased by over half a million people by Q2 2022 – 540,000 compared with Q1 2020, or 570,000 compared with Q4 2019. If we add in those aged older than 65 years, the increase is around 700,000 people.
Figure 1 shows the increase in economic inactivity rates for 16–64 year olds in an historical time series to contextualise the increase, with recessions also shown. Inactivity tends to increase after recessions: the increase since 2020 is larger than following 2008 but smaller than the early-1980s and early-1990s recessions.
The increase in inactivity takes the UK back to late-2018 levels. By itself, this may not appear very striking. But more concerning is that this is the reversal of a strong reduction in inactivity rates seen through the 2010s. It has also been the case historically that increases in male economic inactivity tend to have a ratchet effect, in that they rarely decrease again.
Figure 1
The increase since before the pandemic, using either Q1 2020 or Q4 2019 as a baseline, is largely concentrated among those of older working age and early retirement ages.
What is also different, compared with the 2008 recession, is the composition of who has become economically inactive. At that time, the increase was driven mostly by increased numbers of students, potentially reflecting higher relative youth unemployment rates. This also happened in the early stages of the pandemic but has since unwound.
Long-term sickness did not appear to have been a significant contributor to a rise in economic inactivity following the 2008 recession. However, through the 2010s, where working-age economic inactivity rates reduced, and the total number of inactive people aged 50–69 years fell, the number inactive due to ill health among those aged 50–64 years increased. This suggests that the employment chances of people with ill health fared worse than others through the period.
What has been happening in older age groups?
Prior to the pandemic, the overall number of economically inactive people aged 50–69 years had been falling, alongside inactive people with a long-term health condition and those self-reporting retirement as their reason for inactivity. These trends have been influenced by policy designed to keep people in work for longer, such as increases in the State Pension age (from 2010 for women, and 2018 for men and women until reaching age 66 in October 2020). The main fall in inactivity was among people aged 65–69 years.
Figure 2 shows the number of people by age who were economically inactive in the period Q1 2014 to Q2 2022, whether this was due to retirement or ill health and whether they had a long-term health condition. Reductions in inactivity for those with a long-term health condition and self-reported retirement inactivity had largely been concentrated in the 65–69-year-old group prior to the pandemic, with falls outpacing reductions in the group’s population size. The greatest contribution to the reduction came from fewer people retiring.
However, there was no change for 65–69 year olds reporting they were inactive due to ill health. And the number of 50–64-year-old people self-reporting ill health as their reason for inactivity was gradually increasing – by 110,000 between Q1 2014 and Q1 2020. By Q2 2022, a further 157,000 50–64 year olds reported they are inactive due to ill health since Q1 2020.
After Q1 2020, the working age (50–64 years) portion of the 50–69 age group have seen the greatest inactivity increase (+329,000) and inactivity for those with a long-term health condition (+231,000), growth that is faster than the overall growth in the 50–64-year-old population. By Q2 2022, the absolute effect on the 50–69-year-old age group has been offset slightly by a fall in the size of the 65–69-year-old group.
Figure 2
The number of people aged 50–69 years self-reporting ill health as their main reason for inactivity has also been rising. Figure 3 shows the quarterly change in inactivity by main reason since Q1 2020. Our analysis shows that by Q2 2022, the single largest increase in the reason for inactivity since Q1 2020 for this age group was driven by ill health (200,000 people).
Figure 3
What impact is poor health having on economic inactivity?
Our analysis suggests that poor health is the driving factor for increases in inactivity among older age groups since the start of the pandemic, following a pre-pandemic trend. This is similar to research by Haskel and Martin who point to health-based explanations for the rise in inactivity. Others including the IFS and ONS have highlighted that increased flows into inactivity have been driven by retirement.
Below we delve further into why these interpretations may differ and also investigate the extent to which other factors, such as long COVID and health care backlogs, may be contributing to recent health trends.
Retirement or sickness in those aged 50–69 years?
IFS analysis examines the reasons people give for moving into inactivity from employment or unemployment since the previous 3-month period, comparing averages over 2017–19, 2020 and 2021. It concludes the greatest flow into inactivity was from employment and the greatest change in the reason given for those moving into inactivity was retirement.
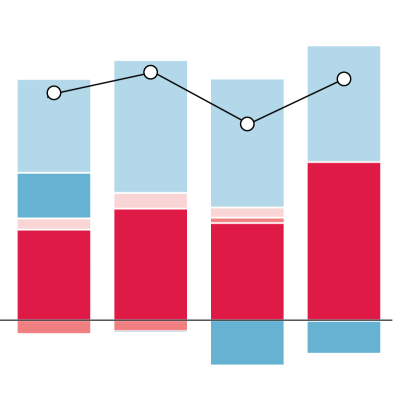
Taking an initial group of 50–69 year olds, Figure 4 shows how many people move between inactivity to employment or unemployment and vice versa between quarters. The chart also highlights 49 year olds and 69 year olds moving in and out of the group. The black marker shows the average net change over the period.
The majority move from employment to inactivity in each period. In 2017–19 these flows were overall largely offset by movements out of inactivity, either through people moving back into work or looking for work, or ageing from 69 to 70 years. In 2020 and 2021 there are more people moving into inactivity from employment. There are also fewer people at the oldest ages leaving the group than in 2017–19, and fewer flowing back into employment. Attempting to boost the workforce by reversing voluntary decisions to retire would appear a much harder ask of policy than overcoming barriers such as poor health. Although implementing successful interventions to achieve the latter has been a challenge historically.
Figure 4
The reasons for inactivity reported by the total group of inactive 50–69 year olds (Figure 2) suggest that the overall reduction in inactivity levels pre-pandemic was driven by falling inactivity among 65–69 year olds. These overall reductions stopped from Q1 2020 due to rising levels of inactivity attributed to ill health among 50–64 year olds, reduced flows from inactivity back into employment and a smaller cohort at the oldest ages in the group. However, the number of people who are inactive with a long-term health condition has remained relatively stable.
Methodological differences
There are methodological factors that could be creating complexity in explaining why more older people have become inactive. This is particularly the case where multiple factors are likely at play and changes relate to a relatively small sub-group of the population. For example, the exact question researchers focus on can differ and numerous questions can be asked within a survey to consider the same issue. These include choices between ‘Why did you leave last job?’ or ‘Why did you not search in the past 4 weeks?’ and ‘Why would you not be available to start in the next 2 weeks?’. The answers to each of these questions could be different: while you may have left work to retire 3 months ago, you could now report ill health as why you are not searching for work.
There are other methodological differences too; for example, choosing a pre-pandemic base year for comparison, which itself may be driven by considerations of sample size or confounding factors within the period chosen. We also know that the longitudinal data, which look at movements between quarters, tend to produce slightly different results to the cross-sectional, capturing a slightly different sample of people. However, it is difficult to measure this overlap across the two versions.
Multiple reasons for inactivity
People can have many reasons for no longer engaging in the labour market, such as sickness, retirement and looking after the family/home. These can exist in combination with each other and people may either have a preference to report one, or identify more strongly with one as the primary reason. Analysis that looks at the main reason only may not capture all the parts of a complicated picture.
Figure 5 shows the change in economic inactivity for people aged 50–69 years by their main reason, and health as an additional reason, across other categories. We find that while the number of people reporting ill health as their main reason has been increasing since Q1 2020, reaching 1.6 million people in Q2 2022, there has also consistently been over 155,000 people who also reported ill health as an additional factor.
In most quarters since Q1 2020 there were increases in how many people reported ill health as an additional reason for their inactivity, but not by Q2 2022. This, coupled with the increase in ill health as a main reason between Q1 and Q2 2022, suggests people could be switching to report ill health as the main rather than additional reason. Altogether, this shows that looking at the main reasons for ‘no longer looking for work’ or ‘leaving last job’ may only give limited insight into the deteriorating picture of health and how it is affecting inactivity.
Haskel and Martin explore this further within the working-age group (16–64 years), finding that having a work-limiting health condition will explain inactivity, even if the individual gives something else as a reason.
Figure 5
Is health worsening?
Over the period Q1 2020 to Q2 2022 the number of people aged 50–69 years reporting a long-term health condition has increased by 315,000 overall. Among those who are inactive an additional 200,000 report poor health as the reason for inactivity. There are a number of ways the pandemic has affected people’s health, so are these factors playing a role?
Long COVID
Long COVID, in which symptoms persist months after a COVID-19 infection, has been suggested as a potential cause of increased economic inactivity. The ONS long COVID survey suggests around 1.7 million people in July 2022 had ongoing symptoms at least 12 weeks after an infection, with 325,000 of these saying it limited day-to-day activities a lot, and 883,000 saying it limited day-to-day activities a little. While estimating long COVID is difficult (unless a control group is used studies suggest that prevalence is overestimated) these are numbers plausibly big enough to influence the inactivity statistics. The age group most affected by long COVID are 35–69 year olds, which potentially aligns with most of the increase in economic inactivity.
Recent estimates (see for example: Haskel and Martin 2022, and IFS 2022) suggest around 80,000–110,000 people are not working due to long COVID, although whether they have become economically inactive is less clear. For example, one of the studies suggests it is due to people being on sickness leave from their jobs rather than having left their job entirely. The FT notes that other countries that have experienced similar waves of infections have not seen an increase in economic inactivity. Overall, this suggests long COVID is playing a relatively minor role in the increase in inactivity.
Waiting lists
One theory discussed by some (including the Financial Times and Haskel and Martin) is that long waiting lists for treatment are causing people’s health to deteriorate and, in turn, leading to them leaving the labour market. While there is some plausibility to this theory as a contributing factor, it is hard to assess the extent from available data.
Using the COVID-19 module of Understanding Society, we can try and assess this theory to an extent by comparing outcomes from data collected through the pandemic to before. Our analysis shows, as we might expect, people who had medical treatment cancelled or postponed by September 2021 did experience bigger increases in poor or fair self-rated health than those who reported ongoing treatment as normal compared with November 2020 (14% increase compared with 7%).
Yet people who reported cancelled or postponed treatment made up around only 8% of those who reported not looking for paid work due to ill health or shielding – around 2% of all of those not looking for paid work younger than 70 years. The sample size is small, but only 5% of those out of work and not looking for work with cancelled or postponed treatment in September 2021 were in employment in April 2020 to begin with. This suggests only a minor role in explaining the increase in inactivity since then.
Recent ONS research finds that one-fifth (18%) of 50–65-year-old people who became inactive during the pandemic – and not returned since – are on a NHS waiting list. But the counterfactual is not clear – some people may not have returned to work if NHS waiting lists were at pre-pandemic levels.
Those waiting for treatment do generally have lower employment rates than those receiving treatment (61.4% compared with 67.3%) but this suggests rather than increasing flows into inactivity, delays in treatment are moving people already out of work further from being able to begin returning to work. There is a risk that for people on sick leave awaiting treatment, or in self-employment unable to work, this situation worsens with time. Where people are unable to access treatment quickly there is a role for employers to consider the mitigating circumstances and leave open a route back to employment beyond current statutory requirements, and for government to provide financial support in this period.
The trends in economic inactivity to some extent reflect broader changes in health outcomes we have seen but not all. Figure 6 looks at the increase in economic inactivity by main health condition reported for those aged 50–69 years.
The largest increases are problems relating to the cardiovascular system, ‘other’ problems and mental ill health. There are some parallels with excess death statistics that show an increase in circulatory and heart-related conditions and the increase in poor mental health during the pandemic. The ‘other’ category could potentially include symptoms related with long COVID, such as fatigue, which are not well captured by the questions asked in the survey.
Figure 6
Pre-pandemic trends and demographic shifts
Holding inactivity rates constant, changes in the age structure of the population explain around 13% of the increase in economic inactivity for 50–69 year olds. Numbers of people aged 50–69 years with poor health had been increasing between 2014 and 2019. We have also analysed whether changes in multi-morbidity and the associated employment penalties might have influenced changes in inactivity, but there is no pattern that suggests they have.
How concerned should we be?
Today, more of the population of economically inactive people are saying they are not working due to ill health than 2 years ago. Between 2014 and 2019, while economic inactivity overall was falling for 50–69 year olds, the number reporting ill health as a reason for inactivity was gradually rising. There are now 1.7 million 50–69 year olds who are economically inactive due to ill health, and 3.8 million who are inactive and have a long-term health condition. And the UK population of 50–69 year olds is growing, set to be over 600,000 more people in 2030 than in 2020.
Nearly 1 in 4 people inactive because of ill health want to work or are seeking work, but are unavailable to start because of their health. They are more likely to want to work than those who have retired, and this should make implementing policies to help people back into work easier because it fits with the preferences of many.
It also matters because the health picture is deteriorating. Life expectancy has been stalling on average over the past decade, while the gap between the wealthiest and the poorest has widened. Long COVID, long waiting lists and the general deterioration in living standards and public-service funding through the cost-of-living crisis threaten to further erode people’s health. This presents the risk that worsening poor health could lead to greater economic inactivity in future.
Urgent action is therefore needed on re-engaging those who are long-term sick and who want to return to work, and for business and government to do more to help keep people in work in the first place and maintain people’s health. Longer term it is important to build greater resilience against future threats to our health by investing in areas that support health, including social security, housing, education and transport.
Further reading
Work with us
We look for talented and passionate individuals as everyone at the Health Foundation has an important role to play.
View current vacanciesThe Q community
Q is an initiative connecting people with improvement expertise across the UK.
Find out more
