Employment and unemployment How does work affect our health?
- This analysis is part of a collection exploring how work affects health.
- The charts on this page explore trends and inequalities in employment, reflecting on what these mean for people's health.
Unemployment has consistently been found to have a negative impact on a range of health outcomes. Reviews have found links between unemployment and self-rated health, with worse effects for men and those unemployed due to health, and ameliorated by strong social networks. There are similar relationships with mental health, including depression, anxiety, and self-esteem.
Bartley outlines four mechanisms by which unemployment might affect health: poverty, stress, unhealthy behaviours, and implications for future employment. Poverty refers to the financial strain and uncertainty that loss of earnings can imply, as discussed in the first section. Unemployment acts as a stressor that can eventually have physiological effects, in a similar vein to financial strain, though there are effects even when controlling for income loss from Scandinavian studies. Unemployment is also thought to increase the risk of future unemployment and become part of a self-perpetuating negative cycle.
The link between unemployment and behaviour is somewhat complicated, given that while it might increase the pressure for unhealthy coping behaviours, it also reduces the financial resources necessary for them. As such, some studies find increases in unhealthy behaviours and others declines in unhealthy behaviours. There are also potential selection effects for alcoholism, for example.
A number of studies find that the health consequences of unemployment increase with duration, for example, on self-rated health, and mental morbidity and life satisfaction. However, overall evidence on the consequences of the duration of unemployment is somewhat mixed with three possible models: dose-response, whereby duration increases the health consequences of unemployment; steady-state after a certain duration; and adaption, whereby after a point there is an adjustment to unemployment. Some research has found a dose-response relationship for women and adaption for men. There is also a potential effect for cumulative employment over life having an impact on health.
This section looks at employment status, which by convention is sorted into three broad categories based on having employment, seeking and being available for employment, or having withdrawn from this (economic inactivity). At an individual level, employment outcomes are related to a number of factors, including educational attainment and human capital, health status, strength of local labour markets, social networks, and factors such as discrimination or employer attitudes.
This section uses a combination of area-level and individual-level measures of employment. These are based around the conventional and internationally standard definitions of employment, unemployment, and economic inactivity.
On this page
What's the association between employment rates and health?
What are the trends in unemployment and underemployment?
Which groups are most likely to be affected by unemployment?
What are the trends in long-term unemployment?
What is the geographical spread of unemployment and long-term unemployment?
What's the association between employment rates and health?
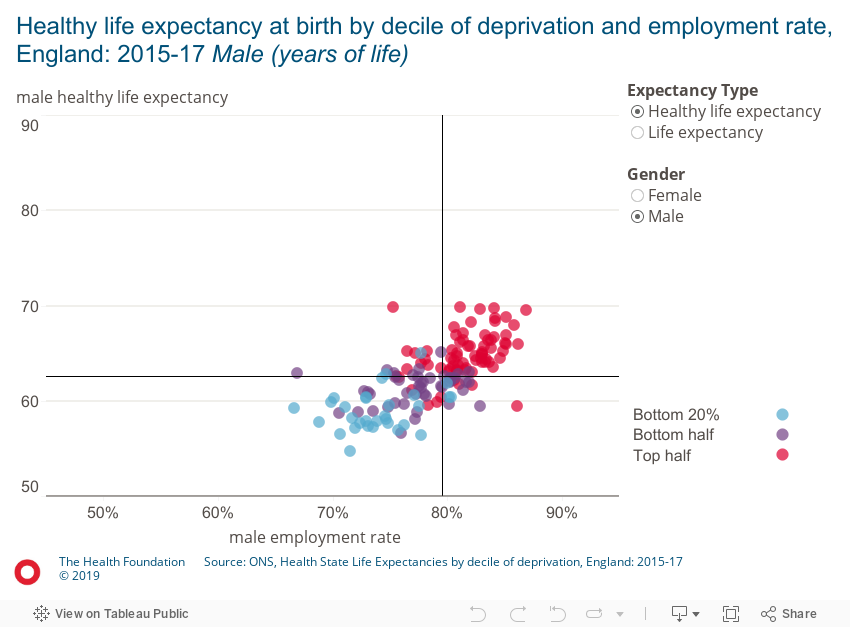
Higher healthy life expectancy is strongly correlated with higher employment rates, particularly for men. On average, for every 10 percentage points higher the employment rate, healthy life expectancy is around 5 years higher.
Why does this matter?
There is significant variation in both health and employment within and between local areas in the UK. Policies aimed at boosting employment can have important positive health impacts.
Discussion
This chart shows the association between employment rates and life expectancy (how many years we can expect to live) and healthy life expectancy (how many of those years are spent in good health). Each series highlights the local authority’s position in the multiple deprivation distribution: whether in the most deprived bottom 20%, the next 30%, or the top half.
- There is a clear relationship between employment and both life expectancy and healthy life expectancy, although it is stronger for men than for women.
- The correlation also tends to be stronger for healthy life expectancy rather than total lifespan.
- An additional 10% of employment is associated with around 5 years of healthy life expectancy in this simple relationship.
- There is a clear pattern with the most deprived fifth of local areas experience both the worst health and employment outcomes. However, a significant share of the 20-30% of most deprived local areas have above typical rates of employment but less than typical health outcomes.
- Further analysis shows that the same relationships between life expectancy and healthy life expectancy with employment rates hold for unemployment rates and for inactivity rates.
- All data is for the two-year period 2015-17 and is measured at the level of upper tier local authorities in England.
- While previous academic work has delved deeper into questions of causation, these charts simply indicate the correlation between employment rates and health.
- For life expectancy, there is an R2 of 0.42 and 0.40 for men and women respectively. For healthy life expectancy, there is an R2 of 0.46 and 0.52 for men and women respectively.
Source: Health Foundation analysis using Annual Population Survey, via NOMIS; Health State Life Expectancies, ONS. Data is for 2015 to 2017.
Trends in unemployment and underemployment
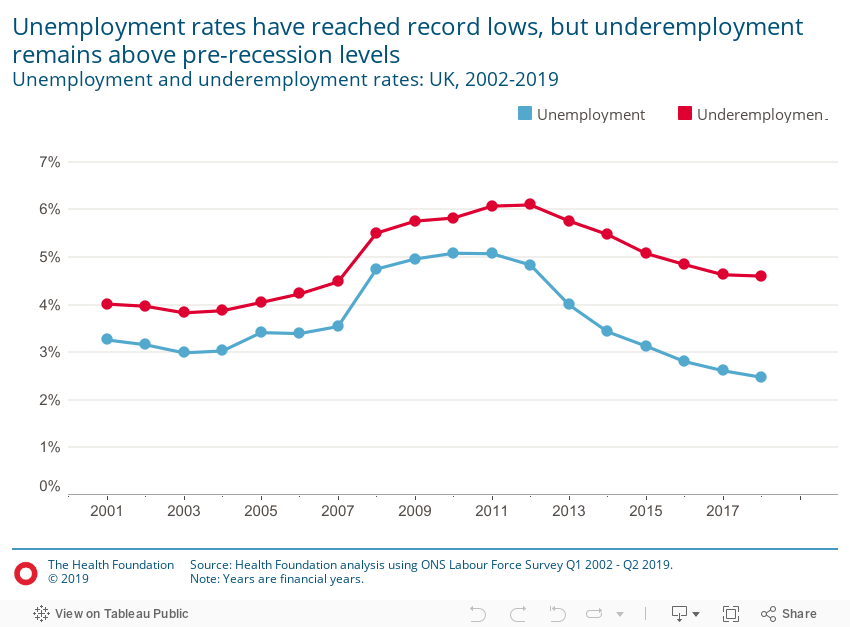
Unemployment rates (people looking for work as a share of those both in and looking for work) have reached record lows in 2019 at only 2.7% in Q2 2019, but the proportion of people underemployed (wishing to work additional hours at the same pay rate) was nearly double the unemployment rate, at about 4.8% and above pre-recession levels.
Why does this matter?
The UK's strong employment performance means that traditional concerns about the impact of unemployment, while still relevant in some areas, must also pay more attention to the risk and impact of underemployment.
Discussion
- Unemployment has declined following the 2009 recession and is now below its pre-recession levels at around 2.6% consistently reaching record lows.
- The proportion of people who wish to work additional hours has also declined from 6.1% in 2013 to 4.6% in 2019. However, the rate remains higher than its pre-recession levels and it is nearly double the unemployment rate. This is illustrative of the changing challenges in the UK labour market.
- The evidence basis for underemployment having health consequences is weaker and less explored than for unemployment, although mental health consequences have been found, if inconsistently. Greater understanding of the impact of underemployment is necessary for what may be an increased feature of the UK labour market experience.
Unemployment is defined as people actively seeking work in the last three months. The unemployment rate is the unemployed population as a share of the active population (unemployed and employed population).
The underemployment measure captures the number of people who:
- were looking for an additional job in the reference week
- were looking for a new job with longer hours to replace their current job in the reference week
- wanted to work longer hours at their current job at their basic rate of pay
To qualify as underemployed, people also need to meet the following two criteria:
- were available to start working longer hours within two weeks
- were working 40 hour or less (for people aged under 18) or 48 hours (for people aged 18 and over)
Source: Labour Market Statistics, ONS.
Why does this matter?
A relatively strong labour market by itself has not been enough to eradicate inequalities in the experience of unemployment across different groups.
Discussion
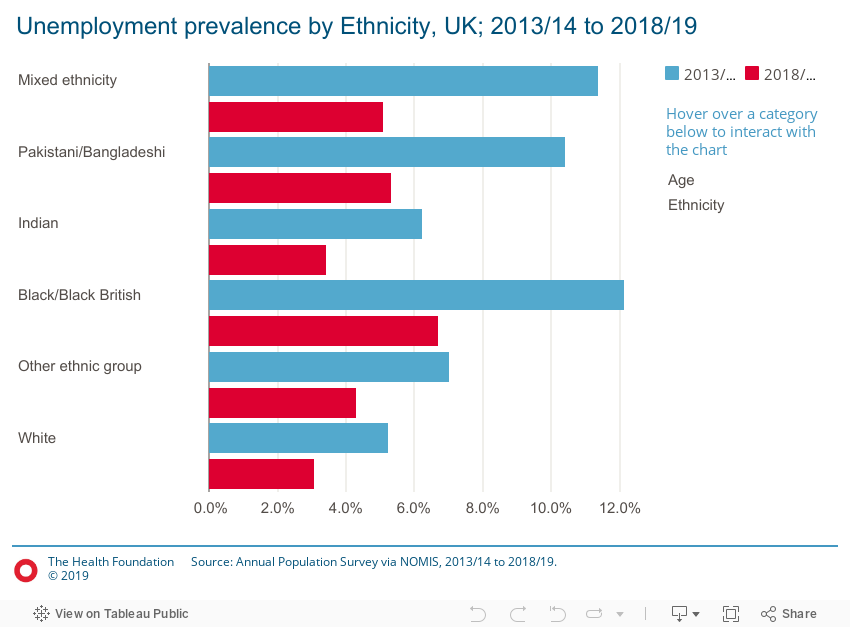
Ethnicity
The proportion of unemployment in each ethnic group has fallen between 2013-14 and 2018-19, reflecting improvements in the overall employment rate. Generally, unemployment fell the most for groups that had the highest unemployment five years earlier: for example, the proportion of Black/Black British adults, the group with the highest unemployment fell by 5.5 percentage points. This reflects that there was more scope for unemployment to improve for groups with higher original unemployment. Despite this improvement, there are still inequalities: the proportion of Black/Black British adults that were unemployed in 2018-19 was twice as high as the proportion of White British adults that were unemployed. Expressed as a ratio between these two groups, Black British unemployment was 2.3 times higher in 2013-14, falling only to 2.2 times higher five years later. The general improvement in the employment rate has therefore not been enough to reduce these inequalities, highlighting that a strong labour market by itself will not necessarily fix inequalities.
Age
Younger age groups are generally more likely to experience unemployment. 7.3% for 16-19 year olds, and 6.8% of 20-24 year olds are unemployed, compared to 3.3% for those aged 25-34. Unemployment is lower for older age groups, but this can reflect higher levels of economic inactivity rather than simply higher employment rates. Younger age groups experienced larger reductions in unemployment over this period: around five percentage points for those aged under 25, reflecting higher initial unemployment among these age groups.
Unemployment is defined as people actively seeking and being available for work. The unemployment rate is traditionally the unemployed population as a share of the economically active population (unemployed and employed population). To allow comparison with groups with different levels of economic inactivity, such as younger age groups with high numbers of students, this chart expresses unemployment as a share of the adult population.
Why does this matter?
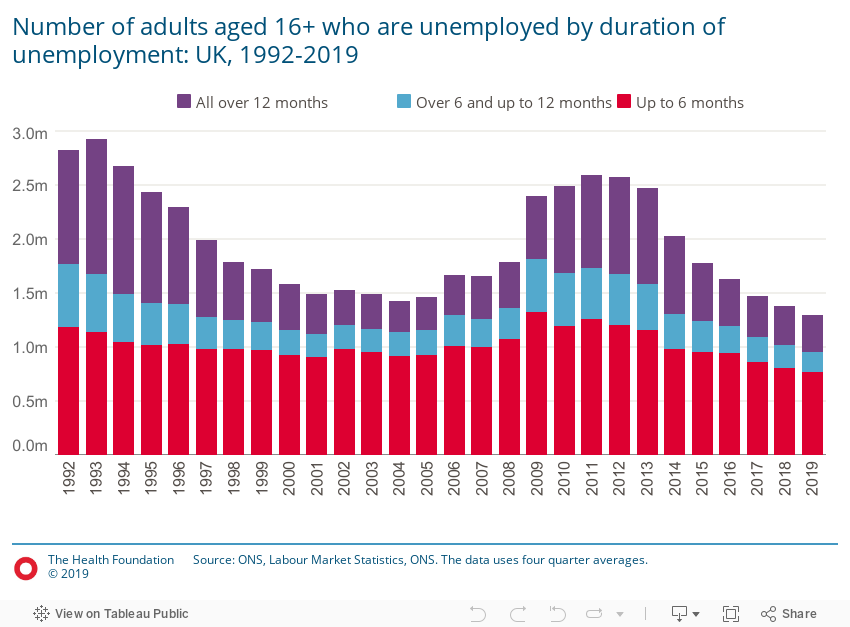
While unemployment has traditionally been a concern from a health perspective, it is at historically low levels. There are more people on potentially insecure contracts (2.4m) than are unemployed (1.3m). This should influence the priorities of central and local governments.
Discussion
The number of people unemployed in the UK was at 1.3 million in the first quarter of 2019, down 80,000 on the 2018 and the eight consecutive year to see a fall in the total number of unemployed people. This is the lowest level of unemployment recorded in the time series of this data source. 59% of the unemployed had been so for less than six months, which is still a lower share than before the recession.
350,000 adults or 24% of the total had been unemployed for over 12 months. This is the lowest since before the recession.
Although this cannot be taken as evidence that unemployment and its health consequences have been “solved”, it does appear that as a relative public policy problem it is relatively diminished and a greater focus should be on work quality and progression.
It is also possible that unemployment could return as a major public policy issue, if there is a recession and no major decline in sterling, which has been historically associated with lower unemployment increases in downturns.
Unemployment is defined as people actively seeking and being available for work.
Source: Labour Market Statistics, ONS. The data uses four quarter averages.
Why does this matter?
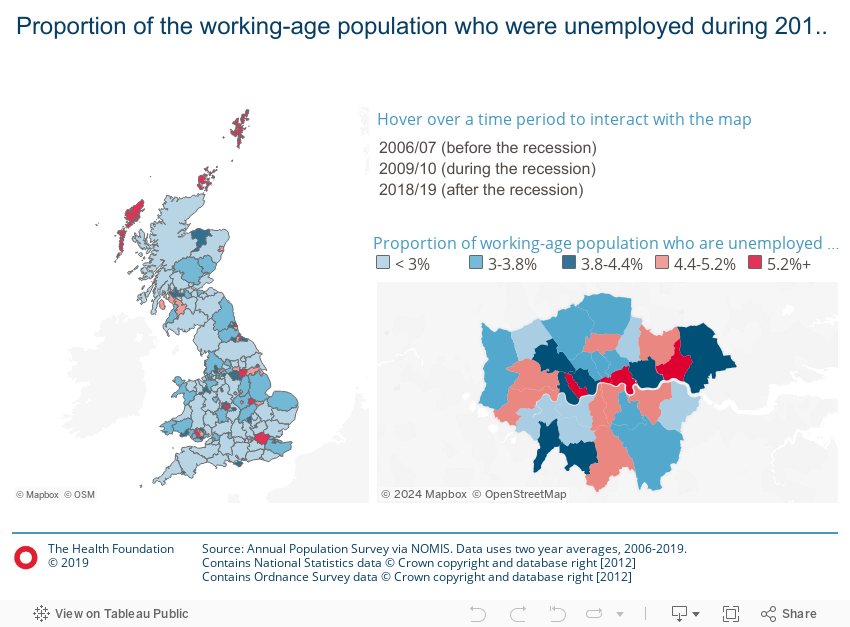
Inequalities in unemployment have softened in the employment recovery since the recession but persist. Some areas have higher unemployment than before the recession.
Discussion
These maps look at Great Britain in three time periods: before, during, and after the recession at the end of the last decade, showing the proportion of the working-age population who are unemployed in each local authority. Unemployment in 2018/19 is lower than the previous pre-recession peak for Great Britain overall, as well as for most local authorities. For the 199 local authorities with consistently available data, 151 have lower unemployment than in 2006/07.
There have also been changes in the distribution of areas of high unemployment over this period. Some local authorities that were middle-ranking for unemployment before the recession are now ranked the worst. Most of these authorities are towns in the north or midlands: Hartlepool, Middlesbrough, Wolverhampton, and Doncaster, for example. These areas generally do not have higher unemployment than before the recession but have not experienced the same improvements.
Although not uniform, another change relative to the pre-recession distribution of unemployment is in London. Only three London boroughs had unemployment over 5.2% in 2018/19, compared to a majority in 2006/07. Other large city local authorities such as Leeds, Liverpool, and Manchester council areas have also experienced improvements relative to their pre-recession relative positions.
Unemployment is defined as people actively seeking and being available for work.
More analysis on work and health
Further reading
Work with us
We look for talented and passionate individuals as everyone at the Health Foundation has an important role to play.
View current vacanciesThe Q community
Q is an initiative connecting people with improvement expertise across the UK.
Find out more
