Why have ambulance waiting times been getting worse?
4 November 2022
Key points
- In England, people are waiting longer than ever for ambulances to arrive. For the most critical calls, with a target response time of 7 minutes, patients in 2021/22 waited 8 and a half minutes on average – almost a fifth longer than they would have waited in 2018/19. For less urgent cases that still require an ambulance response, waits have more than doubled to an average of 3 hours.
- Demand for ambulances has increased. Although the overall number of incidents that require an ambulance response is similar to that in 2018/19, the proportion requiring the most resource – those that are life threatening or an emergency – has increased from 69% to 78%.
- The number of paramedics has increased by 13% since March 2018. But sickness absence, commonly attributed to poor mental health, has increased from 5% in March 2019 to 9% in March 2022 – the highest rate of any organisation type within the NHS.
- Although the workforce has increased, capacity has been reduced because ambulances are waiting longer with patients outside hospitals. In July 2022, more than 1 in 10 ambulances waited over an hour – up from almost 1 in 50 in 2019. In July 2022 waits exceeding the 15-minute standard reduced ambulance capacity by almost 20%.
- Because the system is stretched, small increases in handover times can lead to far greater increases in average response times. The increase in handover delays is a major contributor to the decline in ambulance performance.
- Our analysis suggests three ways to improve ambulance service performance:
- Reduce handover delays by increasing hospital capacity and flow through hospital with more beds, more staff and investment in out-of-hospital care, including social care.
- Increase ambulance service capacity by further increasing staff numbers and reducing sickness absence by addressing the causes of poor mental health.
- Reduce demand for ambulances through greater investment in community services, such as mental health services, which can prevent health conditions becoming crises.
- Tackling ambulance performance will require further investment in the NHS and social care and a comprehensive, funded workforce plan to ensure services have the staff they need.
Introduction
Ambulance services in England are under immense pressure. In July 2022, all ambulance services in England declared REAP (Resource Escalation Action Plan) level four, reflecting potential service failure. Volumes of calls to 999 are increasing, patients in distress and pain are waiting longer for help to reach them, and ambulance teams feel unable to do their job well.
The new Secretary of State for Health and Social Care has previously named cutting ambulance waits as his number one priority. As he takes up the role for the second time, he will again need to include ambulances in his list of priorities for the health and care system. Steps taken to date to help address the underlying issues have not yet had an impact on the pressures facing ambulance services.
This analysis looks at ambulance service performance and explores the contributing factors and priorities for improvement.
Patients are waiting longer to be treated
10.6 million calls were answered by the ambulance services in England between April 2021 and March 2022. Around 7.9 million of these required a face-to-face response. This is around one per year for every seven people in England. A city of 500,000 people (around the size of Sheffield) would have around 200 ambulance service call outs per day.
Ambulance response time targets differ depending how critical the incident is. Table 1 shows the four categories, their targets and response times for 2018/19 and 2021/22. There are targets for the average response time (the average time for all incidents to be responded to) and the 90th centile (the time within which 90% of incidents should be responded to). To ensure that the patient receives attention as quickly as necessary, the ambulance service may respond to incidents with traditional ambulances and other modes of transport including air ambulance and motorbike.
Response times are increasing across all categories and are now well above target, though less so for the more serious categories, in both absolute and relative terms. This is because when services are under pressure serious incidents are given priority by ambulance services. Figure 1 shows increasing response times across all regions.
Table 1: Ambulance response categories and average response times
| Category | Description | Target response time |
Average response time 2018/19 |
Average response time 2021/22 | Change (%) |
|---|---|---|---|---|---|
| 1 |
A time-critical, life-threatening incident (eg cardiac or respiratory arrest) |
7 minutes on average |
00:07:18 | 00:08:39 | 18% |
| 2 |
An emergency that may require rapid assessment and intervention (eg stroke or chest pain) |
18 minutes on average |
00:21:47 | 00:41:18 | 90% |
| 3 | An urgent but non-life threatening condition that may require treatment or transportation (eg late-stage labour or non-severe burns) | 90% should not be waiting longer than 2 hours |
01:01:46 | 02:13:39 | 116% |
| 4 | A less urgent problem that may require transportation to a hospital ward or clinic (eg urine infections) |
90% should not be waiting longer than 3 hours |
01:25:42 | 03:07:10 | 118% |
Figure 1
Long ambulance waits put further pressure on the system. For example, those waiting for an ambulance may call the emergency services to find out where the ambulance is, placing further demand on operators to answer more calls. The average call answer times increased from 7 seconds in 2018/19 to 32 seconds in 2021/22. In the same time periods, the number of answered calls increased from 8.74 million to 10.59 million.
Demand and capacity in the ambulance service
Figure 2 shows a simplified pathway for a patient needing urgent assessment or treatment at the hospital; for instance, a category 1 incident where an ambulance is needed.
Figure 2
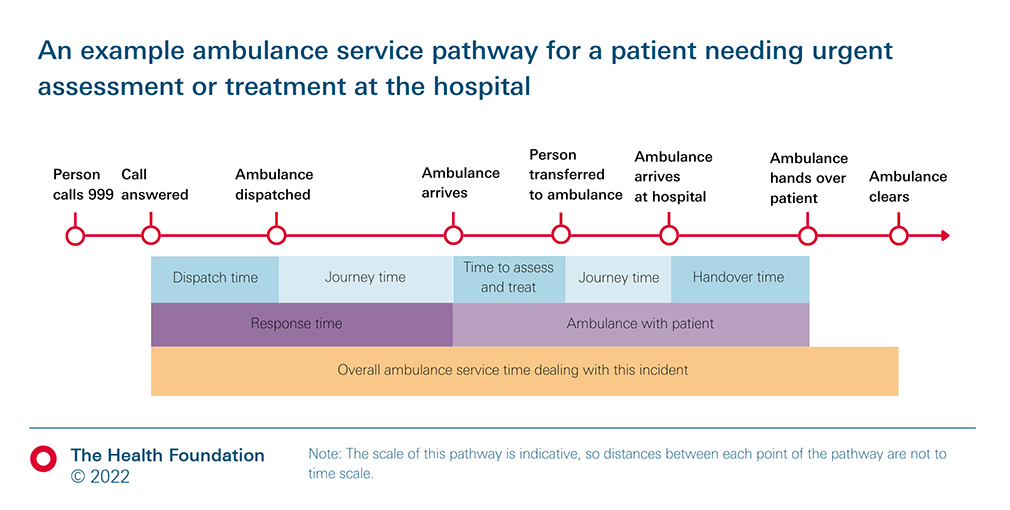
The response time (typically from when the call is answered to when the ambulance team arrives at the patient’s location) depends on both the demand for ambulances and the capacity of the ambulance service. If demand increases (for example, there are more incidents requiring an ambulance), or capacity reduces (for example, because there is a shortage of crews) the average wait for an ambulance will be longer.
Demand for ambulances
Demand depends on both the number of calls received that require a face-to-face response (including sending an ambulance), and how each incident is categorised (for example, multiple resources may be sent to a life-threatening incident).
Figure 3 shows incidents that the ambulance service attended from April 2018 to September 2022 overall and by category. It indicates that the total volume of incidents is similar to the volume seen in April 2018, but the composition of incident types has changed. There has been an increase in incidents being resolved over the phone (‘hear and treat’) but most incidents still require a face-to-face response. In 2021/22 a higher proportion of incidents were life-threatening (category 1, 12%) or emergency (category 2, 66%) compared with 2018/19 (9% and 60%, respectively). These life-threatening and emergency incidents require more resources than categories 3 and 4. The shift towards these more urgent incidents has increased the demand for ambulance services.
Figure 3
Ambulance service capacity
The capacity of an ambulance service can be considered the maximum rate at which it can deal with incidents. This depends on the number of ambulances there are in the system and the length of time each ambulance spends dealing with an incident. As depicted in Figure 2, this is the time taken from dispatch to an ambulance being ready for the next call.
Workforce
Between March 2019 and March 2021 the number of full-time equivalent paramedics increased by around 13%, but there has been virtually no increase over the past year. However, as Figure 4 shows, sickness absence in the ambulance sector increased from 5% in March 2019 to 9% in March 2022 – which implies a reduction in capacity of around 4% points. This is higher than the increase seen at other organisation types. The most common reason for sickness absence among ambulance staff is poor mental health, responsible for a fifth of all sickness absence in March 2022. Despite increases in the workforce, in the 2021 NHS Staff Survey, only 20% of ambulance staff said there were enough staff in their organisation for them to do their job properly, compared with 30% in the 2019 survey.
Figure 4
Ambulance cycles and handover times
Capacity also depends on how long it takes ambulances to complete calls. For example, a 10-ambulance fleet in which each ambulance is able to complete a call in an hour will have a capacity of 10 calls per hour (or one call every 6 minutes). If the length of time it takes to complete a cycle goes up by 15 minutes – for example because the ambulance must spend an extra 15 minutes waiting at the hospital to hand over the patient – the capacity of the service will reduce from 10 calls an hour to eight.
Handover time greatly affects ambulance capacity. This is the time from arrival at the A&E department to handing the patient over to the care of A&E staff and should take less than 15 minutes. 50% of ambulance patients are conveyed to A&E (others are treated on the scene or taken elsewhere).
Figure 5 shows that the percentage of handover times exceeding 30 minutes was higher in winter 2021–22 than in previous winters. Longer handover times mean that patients are not receiving the care that they need from the hospital. The Association for Ambulance Chief Executives (AACE) suggests that in July 2022 alone, 40,000 patients may have suffered potential harm as a result of waiting more than an hour to be handed over to the hospital. Handover delays also mean that ambulance teams spend vital time queueing outside hospitals rather than responding to other calls in a timely way. AACE estimates that in July 2022 the total time lost to handover delays exceeding the 15-minute standard was equivalent to 4,000 ambulance job cycles. We estimate that this amounted to almost 20% of total ambulance capacity in July. Handover delays exceeding an hour have also been worsening. According to 2019 national ambulance data that we requested from AACE, more than 1 in 10 ambulances waited over an hour in July 2022 – up from almost 1 in 50 in 2019.
Figure 5
Impacts on ambulance waiting times
Since 2018/19 demand for ambulances has grown as a result of shifts in the acuteness of cases and although the workforce has increased, this had been moderated by higher levels of sickness absence. However, the biggest change has been the sharp increase in A&E handover times, putting further pressure on ambulance capacity.
But can these changes in handover times lead to the sort of increases in average waiting times that we’ve seen – from around 33 minutes in 2018/19 (across all categories) to nearly an hour in 2021/22? Box 1 shows this can be the case. In our simple model, a 15-minute increase in average handover time increased average dispatch time from 4 minutes to 36 minutes. This illustrates the more general point that in complex systems being run close to capacity, relatively small changes in one area can have disproportionate effects in another. Conversely, resolving the drivers of increased handover times would release ambulance capacity and could help reverse the large increases in waiting times.
This simple simulation model demonstrates that small increases in handover time can magnify and lead to much larger increases in overall waiting times.
Consider a fleet of 10 ambulances serving a population in which, on average, ambulances are called out seven times an hour. An ambulance is dispatched as soon as one is available (ie there is at least one ambulance not dealing with a call). The average time from ambulance dispatch to when it is ready for the next call is 60 minutes (45 minutes travel and treatment time plus 15 minutes handover time), so the theoretical maximum capacity of the 10 ambulances is 10 calls an hour. The model tells us that the time from when a call is received to when the ambulance is dispatched is about 4 minutes. In addition, there is the time it takes the ambulance to reach the patient.
Now suppose the handover time rises from 15 minutes to 20 minutes. The average dispatch time will increase from 4 minutes to around 9 minutes. If the handover time rises again to 25 minutes, the dispatch time rises to 17 minutes. A further rise in handover time to 30 minutes sees the dispatch time rise to 36 minutes. These are all averages so some dispatch times will be much greater than this.
Figure 6 shows the relationship between handover time and dispatch time. In the most extreme case here, when the average handover time rises by 5 minutes from 30 to 35 minutes, the dispatch time rises from by nearly 60 minutes – from 36 to 93 minutes.
Figure 6
Three ways to help improve ambulance service performance
Based on our analysis of the causes of increased ambulance waiting times, we consider three ways of improving performance.
1. Reduce handover delays by improving patient flow
The increase in handover delays is a major contributor to the decline in ambulance service performance, so action to reduce these delays is a priority.
When an ambulance arrives at A&E, the patient will either be admitted to hospital, transferred or treated and discharged. Waits have been increasing for all patients attending A&E, with patients admitted to hospital in an emergency now more likely to be waiting more than 4 hours (from when the decision to admit them was made) than patients admitted before the pandemic (Figure 7).
Figure 7
Evidence suggests that the increases in delays for admission are the result of reduced numbers of unoccupied beds – a 1% point increase in bed occupancy decreases the probability of meeting the 4-hour wait target for A&E by 9.5% points. Occupancy levels in hospitals have remained relatively stable since 2018/19 but since February 2022 this has been above 92.5%, resulting in fewer unoccupied beds (Figure 8).
Figure 8
One reason for high bed occupancy is low and declining numbers of beds relative to demand. England has a low number of hospital beds per capita and in recent years bed numbers have fallen as admissions have risen. Increasing the number of beds, as NHS England is planning, will help but is only part of the solution.
Bed occupancy can also be reduced by discharging patients from hospital who are medically safe for discharge – the number of which is increasing. Delayed discharges can result from waits for assessments or decisions by allied health professionals and clinicians, waits for non-acute NHS care and waits for social care assessments, placements and funding for domiciliary and residential social care. Waits for social care are the result of chronic workforce shortages, a fragile provider market, and insufficient levels of government funding. In September, the government announced a £500m fund to support discharge from hospital into the community, but this is to be funded from existing DHSC and NHS England budgets. A longer term approach to funding and staffing social care is needed to relieve pressure on hospitals and to better support those needing care.
2. Expand and support the ambulance workforce
A fully staffed and healthy ambulance workforce, better supported to do their jobs, is vital. The number of vacancies has almost doubled in the past year and sickness absence rates have increased significantly. The most recent annual NHS staff survey found that 43% of ambulance staff are thinking of leaving their organisation, and only 26% said they are satisfied with their level of pay (down from 29% in 2019).
Ambulance staff were also most likely to report feeling burnt out (51%), followed by nurses and midwives (41%). 61% of ambulance operational staff report feeling unwell as a result of work-related stress and 46% had experienced harassment, bullying or abuse from patients and/or the public. In response to growing concern regarding the mental health of ambulance staff, guidance and tools have been published by AACE and others on preventing suicide in the ambulance service.
Increasing sickness absence rates in the acute sector and others (Figure 4) reduce capacity and may have knock-on effects on waiting times for acute admissions, and ambulances. This is neither safe, nor sustainable. Action is needed to ensure retention of valuable staff, recruit new talent and secure a resilient health and care workforce.
NHS England has also sought other ways to expand ambulance capacity. In August a deal was struck for St John’s Ambulance to provide auxiliary services to the NHS. This contract will see more than 5,000 hours per month of support provided, but this pales in comparison to the scale of the problem. In July alone 152,000 hours (the equivalent to 4,000 job cycles per day) were lost to ambulance handover delays in excess of 15 minutes.
3. Reduce demand for ambulances through improving access to other services
Patients who cannot access the care they need may instead turn to the ambulance service or A&E. One example is children and young people experiencing mental health problems, the number of which is growing. Mental health services are not expanding in line with rising needs, leaving many with limited or no support and increasing use of crisis care. The majority of mental health-related ambulance callouts to children and young people in Wales were subsequently transferred to A&E.
Some trusts have set up ‘emergency mental health departments’ to create a more suitable alternative for people in crisis and relieve pressures on A&Es. The government announced £7m for specialised mental health ambulances across the country to reduce the use of general ambulance callouts for those experiencing crisis. Improved data quality, better linkage of datasets across services and more regular collection of prevalence data would inform service expansion and target support at those in need.
Conclusion
Ambulance services in England were under immense strain during the summer months. Pressures here and across the health and social care system are only likely to increase as we approach winter, and there is an urgent need to address the factors contributing to this strain. Solutions to relieve pressure on the ambulance service and improve outcomes are being developed by local trusts, national charities and by the government. However, underlying this complex problem are issues of funding, workforce and service models. Until there is acknowledgment of this much broader context of pressures, attempts at a solution will only address small elements of the problem.
National, long-term strategies are required to address the crisis in social care that prevents effective patient flow through hospital and causes queues of ambulances outside hospital doors. There must be clear steps put in place to ensure that the workforce shortages that reduce capacity and worsen burn out are resolved. Finally, long-term strategies are also needed to ensure that services including mental health, dentistry and general practice are well-funded and accessible to the patients who need them. Much as seemingly small changes have had huge, injurious consequences for ambulance performance and patient outcomes, solutions targeted at addressing the root causes can help restore performance.
Further reading
Work with us
We look for talented and passionate individuals as everyone at the Health Foundation has an important role to play.
View current vacanciesThe Q community
Q is an initiative connecting people with improvement expertise across the UK.
Find out more
