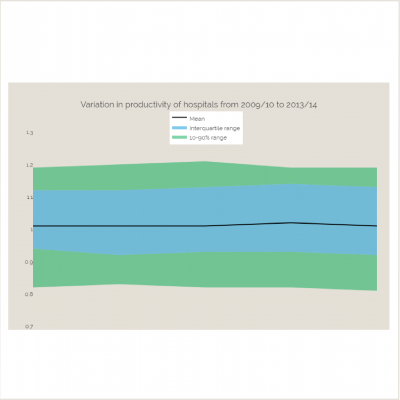
Variation in productivity of hospitals from 2009/10 to 2013/14
18 May 2015

- Variation in productivity among acute hospitals changed little between 2009/10 to 2013/14
- Significant variations of productivity between trusts suggest that potential savings could be achieved if the poorer performers caught up with the best performing trusts.
Between 2009/10 and 2013/14, productivity of acute hospitals increased at an annual average of 0.4%. Although annual change in hospital productivity increased by 0.41% and 2.38% in 2010/11 and 2011/12 respectively, and fell by 0.94% and 0.95% in 2012/13 and 2013/14, little improvement in closing the productivity gap has been achieved over that period.
The chart shows that variation in productivity among acute hospitals changed little from 2009/10 to 2013/14. The 90th percentile of the productivity index range remained around 1.2 meaning and the 10th percentile remained around 0.8.
Similarly, the upper quartile of the productivity index range increased from 1.12 in 2009/10 to 1.13 in 2013/14, while the lower quartile fell from 0.94 in 2009/10 to 0.92 in 2013/14.
Significant variations of productivity between trusts suggest that potential savings could be achieved if the poorer performers caught up with the best performing trusts.
Work with us
We look for talented and passionate individuals as everyone at the Health Foundation has an important role to play.
View current vacanciesThe Q community
Q is an initiative connecting people with improvement expertise across the UK.
Find out more

