The missing lonely Exploring direct and indirect measures of loneliness
18 December 2019

Christmas gatherings and festivities can exacerbate negative feelings associated with being alone, but loneliness is an issue all year round. Loneliness is a concern because it is also associated with poor health outcomes. However, despite increased policy interest in this area, understanding who is lonely and why remains difficult. Simply asking someone how often they feel lonely may miss out individuals reluctant to admit how lonely they really are. So what proportion of people are lonely?
Recent data from the UK household longitudinal study Understanding society sheds light on who is lonely using new indirect measures of loneliness. These indicate that the population of lonely people is 13%, much larger than the 9% identified from the direct measures alone. We can also use this data to understand which groups of people feel lonelier than others and how these ‘missing lonely’ compare to the rest.
Direct and indirect measures of loneliness
The direct measure of loneliness involves asking individuals how often they feel lonely. To improve understanding in this area, last year’s ONS review recommended implementing the three-item UCLA loneliness scale – three questions that explore the frequency of feeling isolated, lacking companionship, and feeling left out.
There are three possible responses to each of these questions: ‘hardly ever or never’, ‘some of the time’ or ‘often’. To calculate the overall level of loneliness, a number is assigned to each of the responses, from ‘hardly ever or never’ equating to 1, to ‘often’ equating to 3. The higher the total score, the higher the level of loneliness. For the purposes of this analysis, individuals are classified as feeling lonely ‘often’ if they score at least 7. They would have answered ‘often’ at least once, and at least ‘some of the time’ twice.
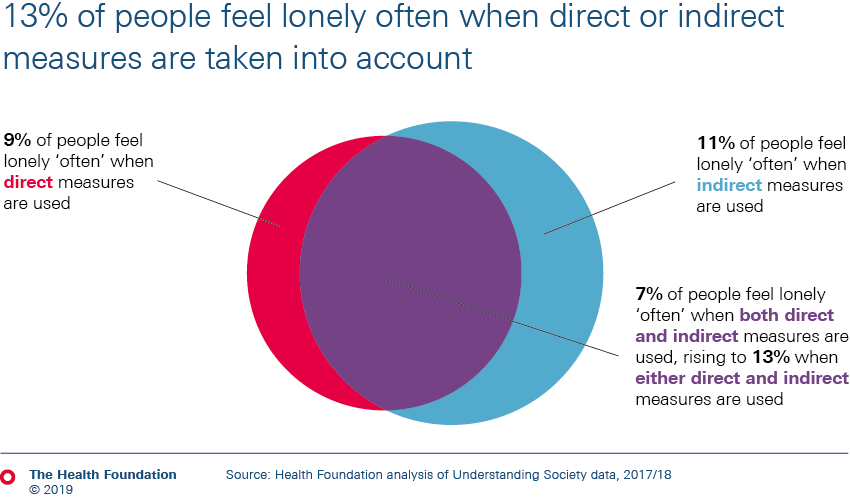
Approximately 9% of individuals directly reported feeling lonely ‘often’, rising to 13% if also including those classified through the indirect questions. As Figure 1 shows, there is significant overlap between those shown to be lonely through both the direct and indirect questions, with an additional 4% of the population classified just through the indirect question.
However, there is debate about the scores used to classify individuals as feeling lonely. Some academics have used the UCLA scores 6–9 to classify an individual as generally lonely, while Age UK have suggested scores of 8–9 for those who are ‘often’ lonely. Clearly this will have an effect on the size of the population identified as feeling lonely ‘often’. For example, using the 8–9 range would identify 10% of the population as ‘often’ lonely instead of 13%.
Why measure loneliness?
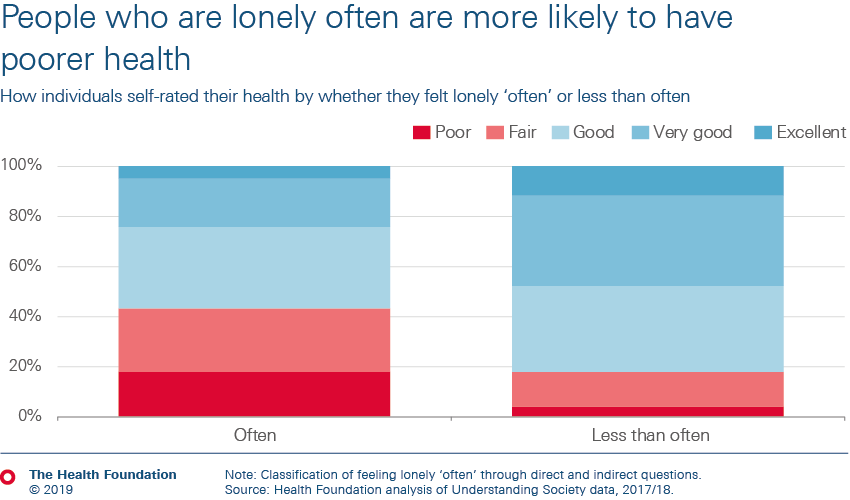
Measuring loneliness is important due to its association with health. This association can be seen in responses to a self-rated general health question on the Understanding society survey. An association was consistent using both the direct and indirect measures of loneliness, with those who are lonely ‘often’ twice as likely to self-rate their general health as ‘poor’ or ‘fair’.
An association also exists between loneliness and responses to the General Health Questionnaire (GHQ), which measures mental health. It does so on a scale of 0–12, where 0 indicates a less distressed mental state. Those identified as ‘often’ lonely were more distressed, for example only 24% of those identified as ‘often’ lonely had the lowest score of 0, compared to 64% of those not classified as ‘often’ lonely.
The relationship between loneliness and health is thought to be bi-directional, where poor health may result in loneliness and loneliness itself may impact physiological health. There are a number of possible mechanisms for how loneliness arises and some, such as the quantity and quality of social contacts, could be linked to health. For example, illness may prevent people from forming social connections or break existing contacts through strain. Loneliness has been associated with a higher risk of physical conditions, such as coronary heart disease and stroke and high blood pressure , as well as mental health conditions, such as depression and dementia.
Who is most likely to be lonely?
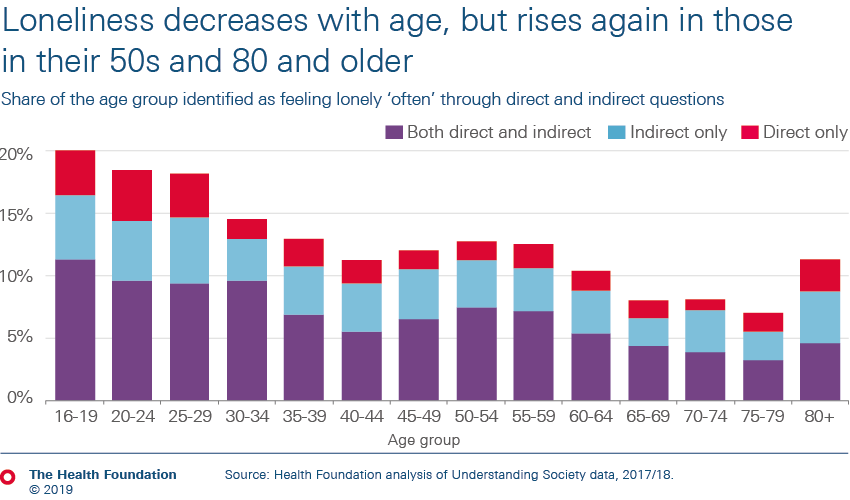
Age appears to be an important factor in loneliness and this is the case across direct and indirect measures. Loneliness generally decreases with age, with exceptions seen in those in their 50s and for those aged 80 years and older. The high levels of loneliness reported in younger ages is a reminder that life transitions can increase feelings of loneliness, acting as an obstacle to forming positive social relationships. These differences over age may be due to a number of reasons, such as differences in how the questions were perceived.
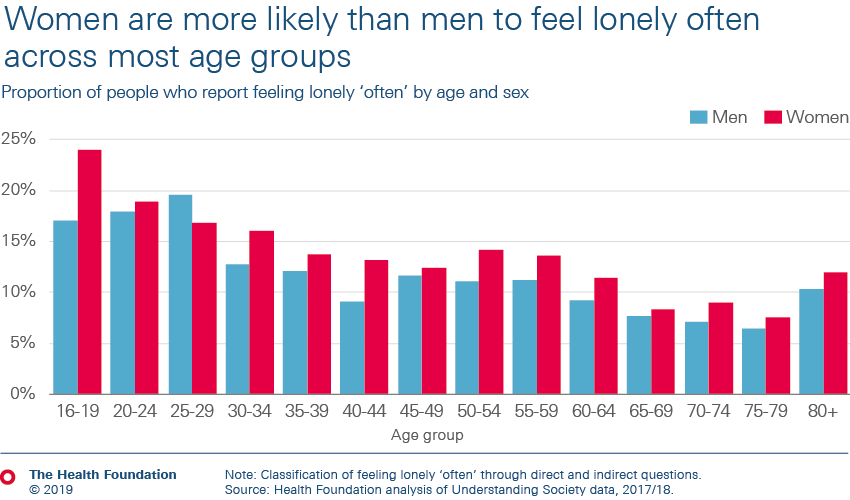
Women are more likely than men to feel lonely ‘often’ in almost all age groups. Interestingly, men were not more likely to be classified as feeling lonely ‘often’ through the indirect measure. This differs from previous research using a different indirect measure, whereby men were found to report loneliness more often using the indirect measure but not the direct.
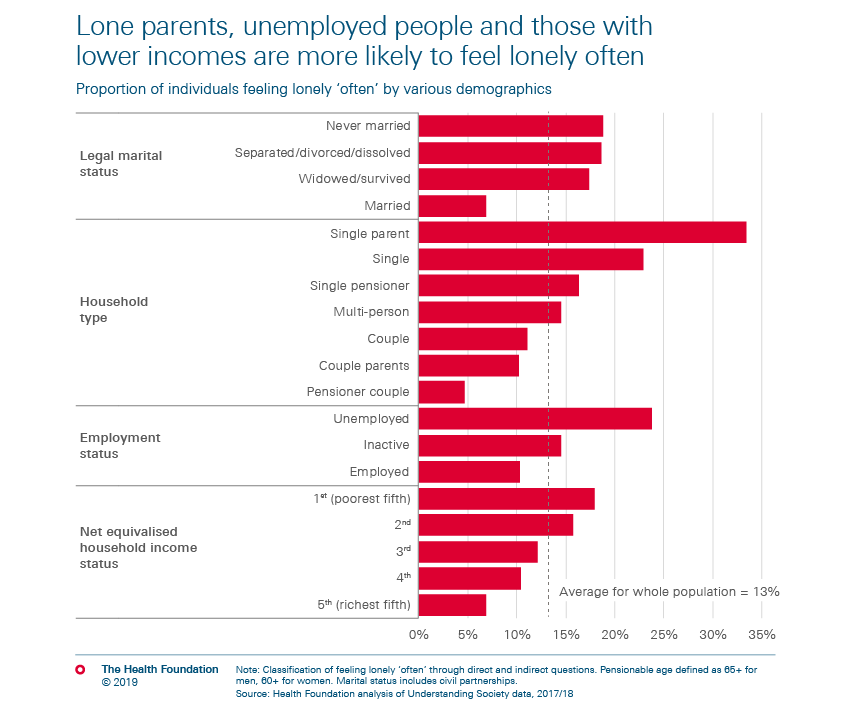
Other factors associated with loneliness were legal marital status, with those married or in a civil partnership reported feeling lonely ‘often’ the least. Having children is likely to increase feelings of loneliness. Additionally, lone parents, those unemployed and those with lower incomes reported feeling lonely ‘often’ more than others. These are the groups where policy action is needed most, and highlights that loneliness is associated with compounded factors of disadvantage.
What does this mean for our understanding of loneliness?
The number of lonely people is larger than the direct questions on loneliness suggest. This demonstrates the need for wider approaches to understanding this issue – such as greater use of the indirect questions. However, even these indirect measures may still not provide a true representation of loneliness in the UK. The questions themselves are still somewhat direct, so there is certainly further room for exploration and innovation in devising measures that can provide a more accurate picture of loneliness.
The data also demonstrates that loneliness is prevalent in groups other than older adults, who have historically tended to receive the most attention. The inclusion of indirect measures emphasises the extent of loneliness among younger age groups. The health implications of this, and size of the lonely population, underlines the importance of policy in this area and that the new government has work to do in building on 2018’s loneliness strategy.
Further reading
Work with us
We look for talented and passionate individuals as everyone at the Health Foundation has an important role to play.
View current vacanciesThe Q community
Q is an initiative connecting people with improvement expertise across the UK.
Find out more
