Health Foundation response to CQC’s State of Care report
13 October 2016
Responding to the publication of the Care Quality Commission’s State of Care (2016) report, Dr Jennifer Dixon, chief executive of the Health Foundation said:
'Today's report shows that, against the odds, most health and social care providers in England continue to provide high quality care, despite an extremely challenging context.
'Cuts to social care are impacting on the NHS. Local government funding for social care fell by an average of 2.2% a year in real terms between 2009/10 and 2014/15. The number of older people receiving publicly funded social care has fallen by over a quarter over this period - those who can’t afford to pay privately lose out the most. For the NHS the result is acute and avoidable pressure, in particular on emergency services and hospital beds due to higher admissions and ‘delayed discharges’ – with patients unable to leave hospital because the right support is not in place. Hospitals are running very hot and only just coping, despite obvious staff shortages.
'While the CQC reports that 51% of core services provided by acute NHS trusts were rated ‘good’ and 5% ‘outstanding’, it is worrying that inadequate care was particularly found in urgent and emergency services, and other medical services that mainly serve older people.
'Further deterioration in social care will drag down NHS performance with it. This is a high risk situation needing an urgent political solution. The evidence shows that new funding streams for social care in the 2015 Spending Review are not enough. The autumn statement is an opportunity for the government to address these challenges in the face of mounting risks to patient care.'
Media contact
Creina Lilburne
creina.lilburne@health.org.uk
020 7257 8027
Additional charts:
Please find below some additional charts which you may find useful, based on Health Foundation analysis of available data. Please credit the Health Foundation if used. If you need any of the chart data, please ring Creina Lilburne on 020 7257 8027.
Chart 1: Relative change in funding between NHS and social care (2003/4-2013/14)
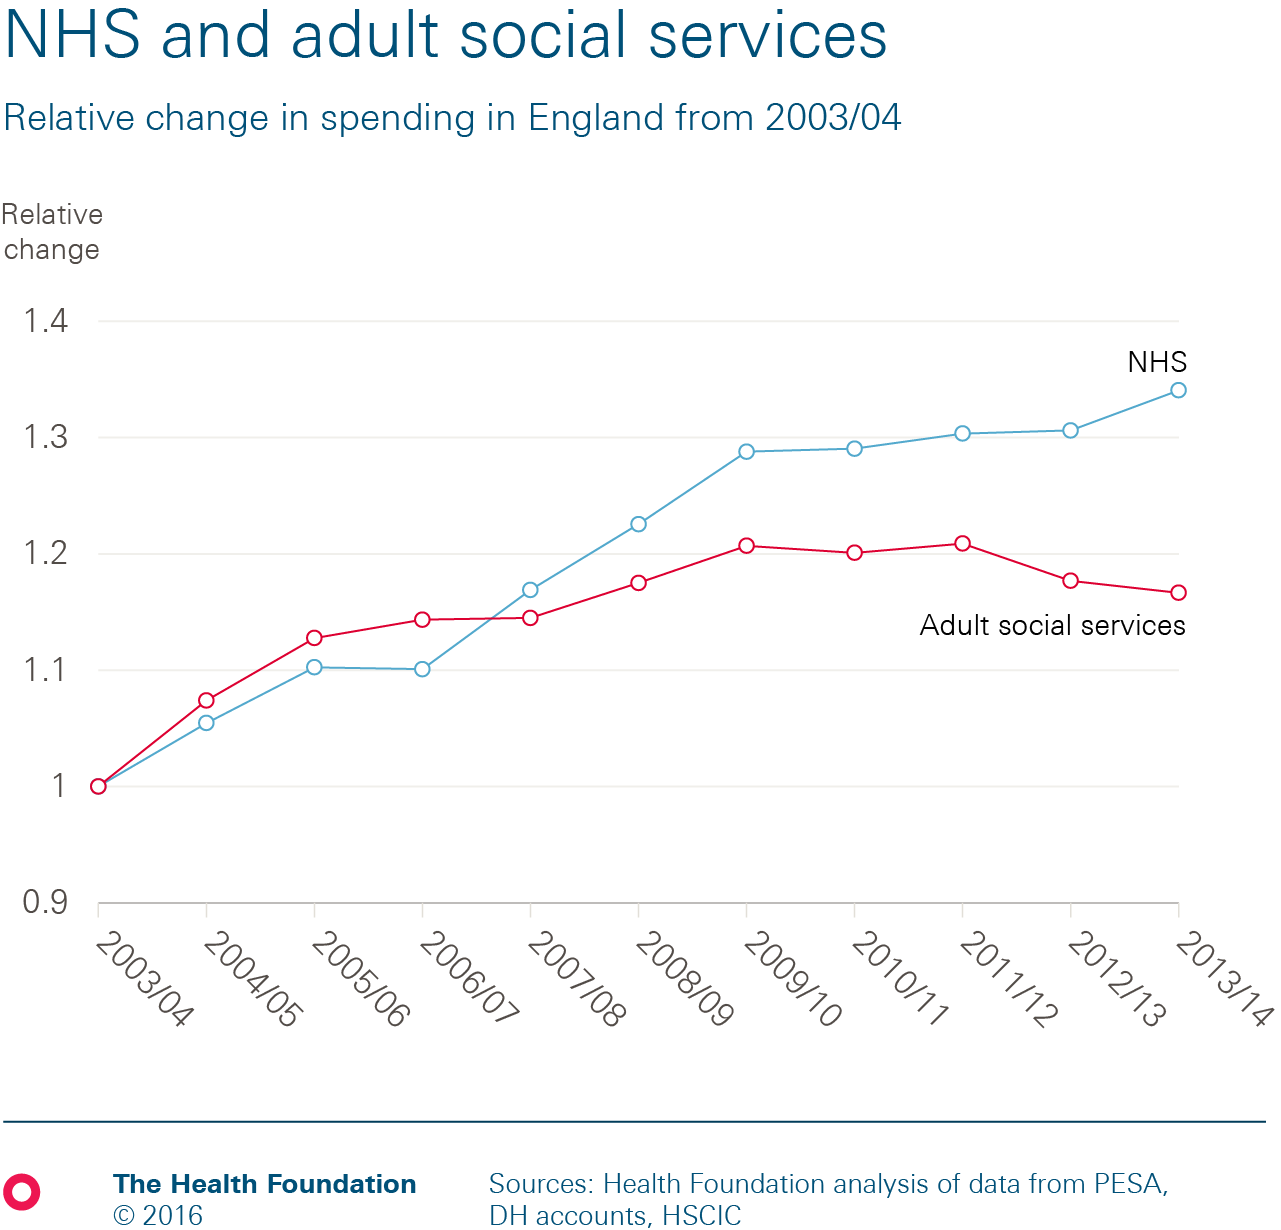
Chart 2: Trends in hospital activity
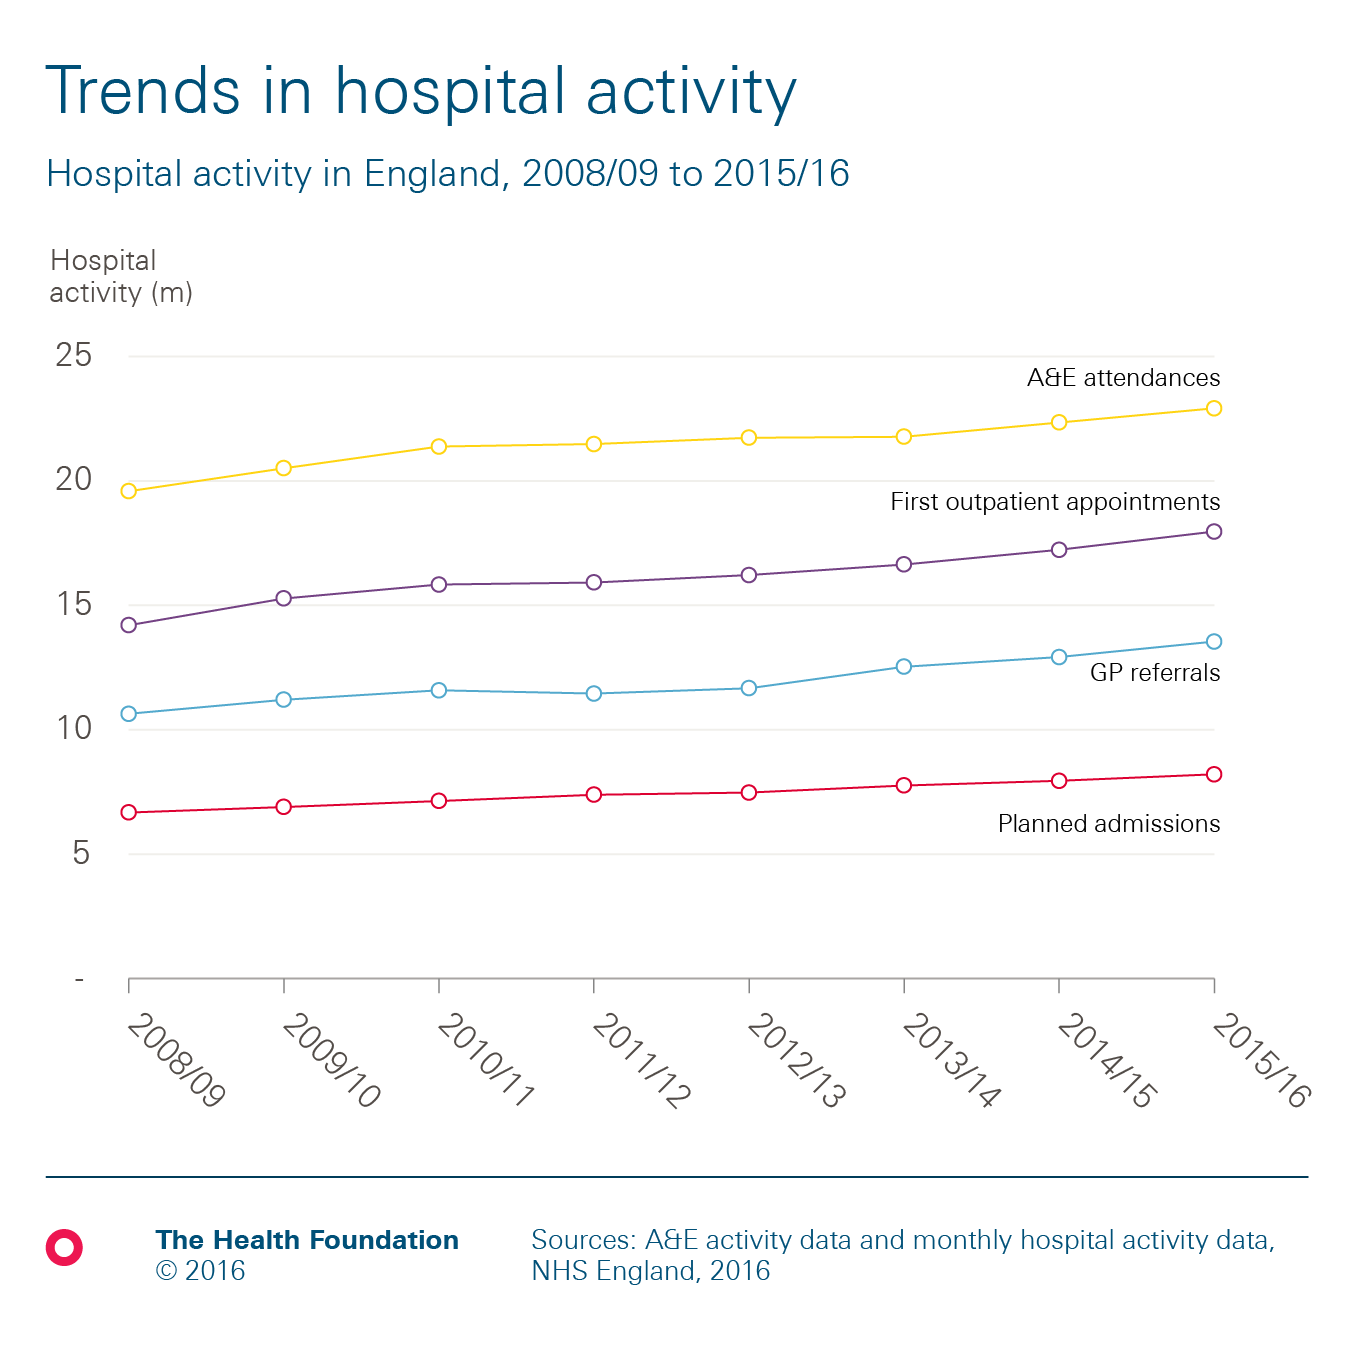
Chart 3: People receiving social services
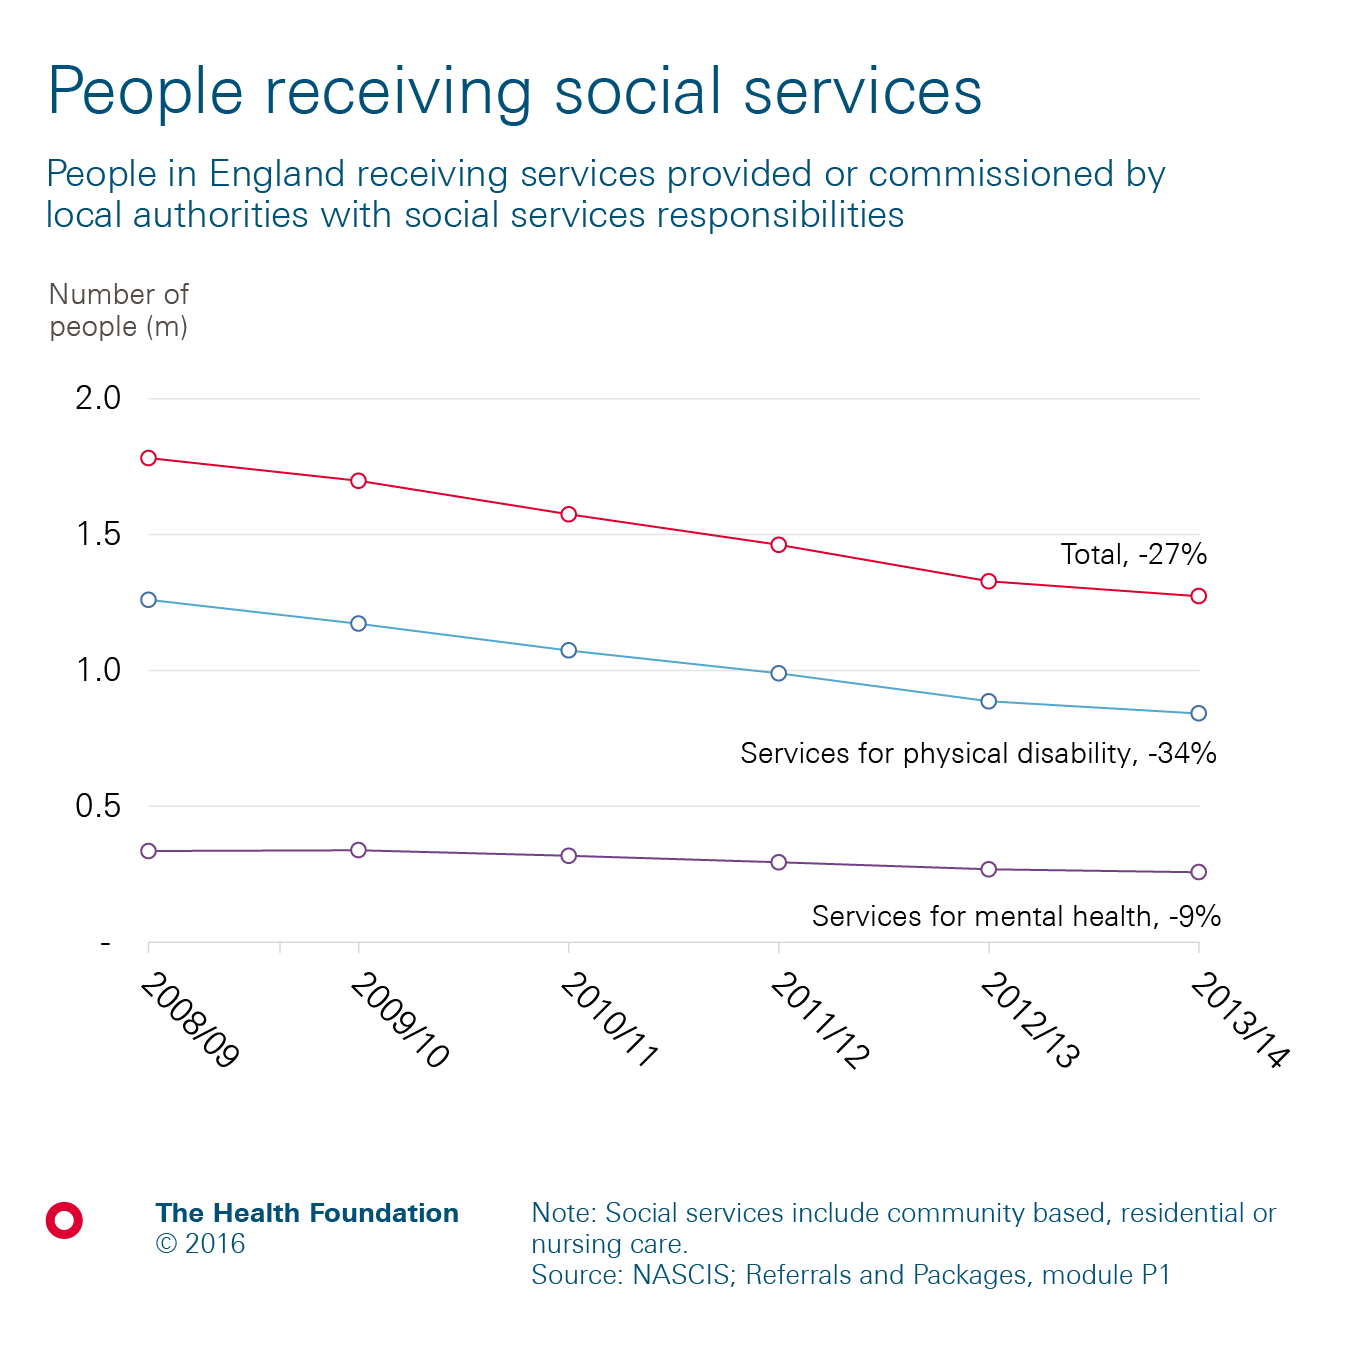
Chart 4: Delayed transfers of care (2011/12 – 2015/16)
![]()
Work with us
We look for talented and passionate individuals as everyone at the Health Foundation has an important role to play.
View current vacanciesThe Q community
Q is an initiative connecting people with improvement expertise across the UK.
Find out more
