Why are delayed discharges from hospital increasing? Seeing the bigger picture
3 March 2023

Key points
- Patients who stay in hospital when they are ready to be discharged are at higher risk of hospital-acquired infections and of losing mobility and independence. Delays in discharging patients also impact on the availability of hospital beds, leading to delays in ambulance handovers and in admitting patients from A&E.
- In December 2022, more than 13,000 beds – out of a total of around 100,000 hospital beds in England – were occupied by patients who were medically fit for discharge, an increase of 57% since December 2020. Although changes to the way data are collected make it difficult to compare with pre-pandemic data, the rate of growth over the last 2 years is unprecedented.
- This is not due to a slowdown in the rate at which patients are discharged – over the past year, the number of patients being discharged from hospital has increased by around 300 per day. However, the number of new patients who have been treated and are ready for discharge has increased by around 650 per day, explaining the increase in the number of patients medically fit for discharge who remain in hospital.
- The average wait between being deemed fit for discharge and actually being discharged was 1.3 days in December 2022. This average includes many patients who aren’t delayed at all; most delayed patients experience much longer discharge waits. This average masks significant regional variation: the average wait in the north west of England was 2.1 days, which was twice as long as in the east of England or London (1.0 day).
- Policy and media attention has often focused on social care as a key cause of the increase in discharge delays. Social care services are under huge pressure, and this is certainly contributing to problems with timely discharge. However, the percentage of patients experiencing delays who were waiting for social care services did not increase between February and December 2022, and was around 37% at the end of 2022.
- Although the percentage of delays due to patients waiting for social care services was increasing before the pandemic, it has never accounted for the majority of delays. Data collected just before the pandemic also show that, in February 2020, social care was recorded as solely or jointly responsible for 40% of delays, with the NHS solely responsible for the remaining 60%.
- The focus on delayed discharges reflects wider pressures on the health and care system which have seen hospital bed occupancy increase to above 95% among adult general and acute beds in September–December 2022, well above recommended levels. This increases the risk of infection for patients, adds to pressures on staff and is not sustainable.
- Policymakers have responded to increases in delayed discharges through a series of piecemeal initiatives and funding increases. A longer term approach is needed, including investment to increase hospital capacity and staffing, as well as meaningful social care reform.
Background
In December 2022, more than 13,000 of a total of around 100,000 hospital beds in England were occupied by patients who were medically fit for discharge. This number has increased by 57% over the last 2 years, representing an additional 6,000 people waiting in hospital who do not need to be there. This reduces the availability of hospital beds for newly admitted patients, contributing to longer A&E and ambulance waiting times. Delays can also have a significant impact on patients: longer hospital stays increase the risk of hospital-acquired infections and patients may lose mobility and cognitive function, making it harder to regain their independence after leaving hospital and increasing their need for care. Delays can also be stressful for the family and friends of people stuck in hospital.
The policy and media narrative about delayed discharges often focuses on limited capacity in social care as the root cause of delays. In January 2023, the government announced an additional £200m for extra beds in care homes and other settings to speed up hospital discharge. This followed the announcement of a £500m adult social care discharge fund in September 2022. But there are a mix of other factors that can cause problems discharging patients from hospital, including challenges accessing other NHS services in the community and poor hospital processes.
Discussion about what is driving the recent increases in delayed patient discharges is based on a limited set of data collected from hospitals. These data were recently described by Sir David Nicholson, chair of Worcestershire Acute Hospitals NHS Trust and Sandwell and West Birmingham NHS Trust, and a former chief executive of NHS England, as ‘useless’ and ‘designed to show how bad social care is’. So what can we learn from the data about delays in discharging people from hospital?
Data, approach and limitations
This research uses open access NHS data on hospital discharge and bed occupancy. We use delayed transfers of care (DTOC) data on the number of patients experiencing delays from September 2010, and data on reasons for delay from August 2010, until February 2020. We used COVID-19 daily patient discharge situation reports (‘SitRep’) data from October 2020 until January 2023. SitRep data not publicly available on the number of patients with delays between October 2020 and April 2022 were obtained from previous analysis by the Nuffield Trust, and data on reasons for delays between February and December 2022 were obtained from NHS England.
Quarterly data on bed occupancy between Q1 2010/11 and Q3 2022/23 for all general and acute overnight beds under consultant care in England were obtained from bed availability and occupancy data. Monthly data on bed occupancy between December 2020 and December 2022 for adult general and acute overnight beds in acute trusts in England were obtained from urgent and emergency care daily situation reports.
We described the number of patients experiencing delayed discharge between September 2010 and January 2023 using DTOC and SitRep data. We calculated the median number of total patients remaining in hospital who were fit for discharge and patients discharged from hospital from 1–21 December 2021 and 2022 published in the SitRep data (we used information from the first 3 weeks of December to remove the effect of different discharge practices around Christmas).
We calculated new patients fit for discharge as the total number of patients fit for discharge on a given day, minus the number of patients fit for discharge remaining in hospital at the end of the previous day. As above, the median was calculated for 1–21 December. We calculated the average discharge wait as the median number of patients fit for discharge remaining in hospital, divided by the median number of discharges each day. We report this for England as a whole, and for each region and integrated care system.
We report the percentage of patients whose delays are due to waiting for social care as those ‘awaiting residential home placement or availability’, ‘awaiting nursing home placement or availability’, or ‘awaiting care package in own home’ in DTOC data. We calculated it in SitRep data as those ‘awaiting home care’ or ‘awaiting permanent bed in a nursing or care home’. These categories and patient populations are not directly comparable.
As set out in Table 1, earlier DTOC data used stricter criteria in their definition, which included only patients deemed ready for discharge by all relevant professional groups (both the NHS and social care for patients with care needs). In contrast, the newer SitRep data count all patients considered medically fit for discharge by the NHS only. This likely explains in part the higher number of patients with delays reported in the newer SitRep data.
In addition, SitRep data are unvalidated management data: different hospitals may count patients at different times of day, and the increases observed may be partly driven by changes in reporting, alongside real increases in patient discharge delays.
Lastly, the categories used for reasons for delays changed and are not comparable between DTOC and SitRep, and we were unable to identify patients waiting for ‘home care’ by social care services only; as a result, our percentages of delays due to patients waiting for social care services are overestimates.
Trends in delayed discharge from hospital
It is not possible to reliably compare delays in hospital discharge now with pre-pandemic delays, because the way these data are collected changed during the COVID-19 pandemic (Table 1). However, we can still compare trends separately before and after 2020.
Table 1: Comparison of publicly available data sources on hospital discharge delays, pre- and post-2020
| Up to February 2020 | From October 2020 (publicly available from 29 November 2021) | |
|---|---|---|
| Dataset | Delayed transfers of care (DTOC) | COVID-19 daily patient discharge situation reports (SitRep) |
| Data validation | Validated published data | Unvalidated management data |
| Definition | Patient identified as ready for discharge by multidisciplinary team meeting involving NHS and other professionals including social care where relevant | Patients identified as medically fit for discharge ('no longer meeting the criteria to reside in hospital') by NHS only |
| Patient minimum length of stay for inclusion | None | None* |
| Reporting frequency (number of patients experiencing delays) | Monthly | Daily |
| Organisation responsible for the delay | Categories: NHS, social care, or both | Not collected |
| Reason for delay | Differences in categories used in DTOC and SitRep, eg in DTOC data ‘awaiting residential home placement or availability’ and ‘awaiting nursing home placement or availability’ vs. different single category in SitRep data ‘awaiting permanent bed in a nursing or care home’ (SitRep data on reasons for delay not publicly available) | |
*Correction: a previous version of this analysis incorrectly stated that the number of patients with delayed discharge reported in SitRep data included only patients staying at least 7 days since hospital admission. The guidance does not specify a minimum length of stay, although inconsistencies in the data suggest there may be different reporting practices across trusts. (Reasons for delays information is only reported for patients staying at least 7 days since hospital admission.)
Figure 1 shows these trends using the two different data sources. Under the old methodology, the number of delayed transfers of care (DTOCs) remained stable between 2010 and 2014. It then increased, peaking in 2016/17 before falling back again. Numbers were on the rise in early 2020, but were still some way from their previous peak.
When data collection resumed using the new method, the average number of patients no longer meeting the criteria to reside in hospital was around 8,400 in December 2020. A year later it had risen to around 10,000 and reached an average of above 13,000 patients in late 2022. The scale of this increase from December 2020 to December 2022 is unprecedented.
Figure 1
How have discharge wait times changed over time?
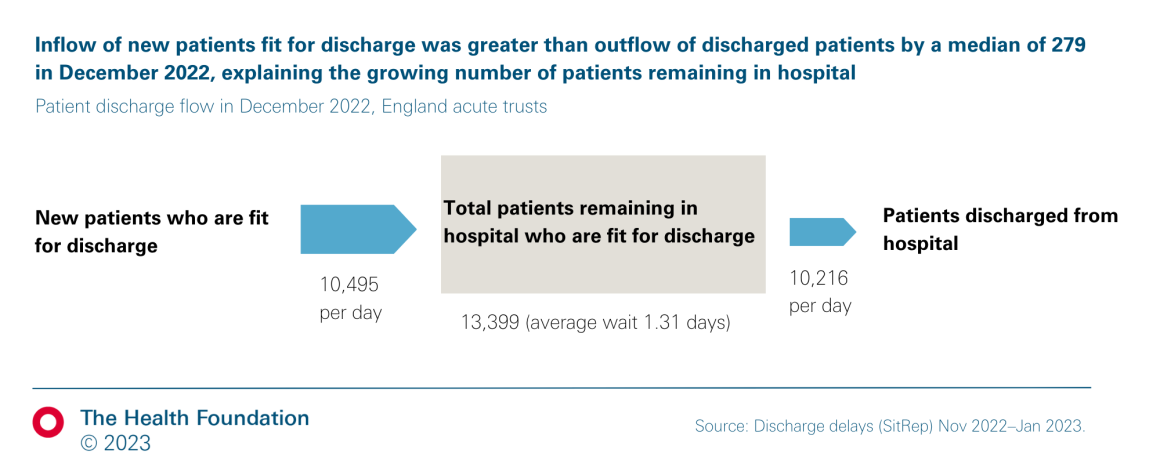
Despite some limitations, the data can help us understand how changes in patient flow and discharge wait times have contributed to the recent increase in delayed discharges. As set out above, the number of patients who are medically fit for discharge but remain in hospital at the end of each day reached more than 13,000 in December 2022. This number is determined by both the rate at which patients are discharged (around 10,000 per day), and how long patients wait to be discharged (from being declared fit for discharge until they are actually discharged), as shown below (Figure 2).
Figure 2
We compare data from the first 3 weeks of December 2021 (we use data from December 2021 because earlier data are not publicly available) and December 2022 to look at the relative contribution of these (Table 2).
Table 2: The number of patients fit for discharge who remain in hospital rose by 27% between December 2021 and December 2022, reflecting an increasing average discharge wait
| Period | New patients fit for discharge each day (median) | Patients fit for discharge remaining in hospital at the end of each day (median) – A | Discharges each day (median) – B | Average discharge wait (calculated as A/B) |
|---|---|---|---|---|
| 1–21 December 2021 | 9,843 | 10,619 | 9,925 | 1.07 days |
| 1–21 December 2022 | 10,495 | 13,399 | 10,216 | 1.31 days |
| Change | 7% | 26% | 4% | 22% |
Sources:
Between December 2021 and December 2022 the number of patients discharged increased by around 300 per day: this indicates that, far from hospitals becoming less efficient, they have increased their daily patient discharge flow in the past year. However, the number of new patients fit for discharge grew by an average of 650 per day. The inflow of patients ready for discharge was greater than the outflow of patients discharged by around 300 people in December 2022 (Figure 2). This explains the increase in the number of patients experiencing delayed discharge, from 10,619 to 13,399 in the past year: the average discharge wait also increased as a result, from 1.07 to 1.31 days (Table 2). This average includes some patients with no delays (ie they are discharged on the same day as the decision to discharge); most patients who experience delays wait much longer.
The average discharge wait varied widely across regions (Figure 3). In the north west, the region with the longest average discharge wait, the average delay was 2.07 days – more than double that in the east of England and London. There is significant variation between integrated care systems (ICSs) too, with average delays exceeding 3 days in Birmingham and Solihull, Gloucestershire, and Cheshire and Merseyside ICSs, and less than 1 day in nine ICSs, including Mid and South Essex (0.51) and Leicester, Leicestershire and Rutland (0.68).
Figure 3
Where can delays occur along care pathways?
In Figure 4 we consider two possible care pathways involving patients needing support after leaving hospital, when they are discharged either back to their own home or to a community setting (such as a care home). The first pathway is a traditional model, where a full needs assessment takes place in hospital and patients are discharged directly to their longer term place of care. The second is a ‘discharge to assess’ model, under which a limited needs assessment is carried out in hospital and patients are then discharged home or to other community settings including care homes (see Box 1), where a more detailed assessment of their needs takes place to inform their longer term care.
Recent years have seen a flurry of changes to national policy on hospital discharge, in response to the COVID-19 pandemic and increasing delays. In March 2020, NHS England asked hospitals to urgently discharge patients who were medically fit to leave, to increase capacity to treat COVID-19 patients. National guidance asked all NHS trusts to implement a ‘discharge to assess’ approach (with people discharged to their usual residence before their future care and support needs are assessed), while many existing review and assessment processes (such as eligibility assessments for NHS Continuing Healthcare) were paused until later that year to reduce delays.
Between March 2020 and March 2022, the government provided discharge to assess funding to cover the costs of care in people’s homes or community health and social care settings for 6 weeks after discharge – although funding uncertainty continued throughout this period. The government also provided several short-term local authority grants to increase social care capacity, indirectly supporting hospital discharge. And in late 2021, a national discharge taskforce was established to lead a ‘drive’ on discharge that winter and the next year.
From April 2022, new national discharge guidance continued to recommend the discharge to assess approach, but national funding was ended. In summer 2022, NHS England announced a ‘100-day challenge’ to reduce discharge delays and prepare for winter, asking all trusts to implement interventions identified by the discharge taskforce as best practice.
Faced with increases in patients awaiting discharge and growing hospital pressures in late 2022, last-minute financial support was introduced from existing budgets. Therese Coffey’s 'plan for patients’ in September 2022 announced a £500m ‘adult social care discharge fund’, although this money was not distributed until December 2022 (£300m to integrated care boards) and January 2023 (£200m to local authorities). In January 2023 NHS England also made a £200m ‘hospital discharge fund’ available for integrated care boards, primarily to block-book care home placements for 4 weeks after discharge.
Figure 4: Discharge to assess models aim to bypass some sources of delays which exist in direct discharge pathways for patients with non-acute NHS, social or community care needs
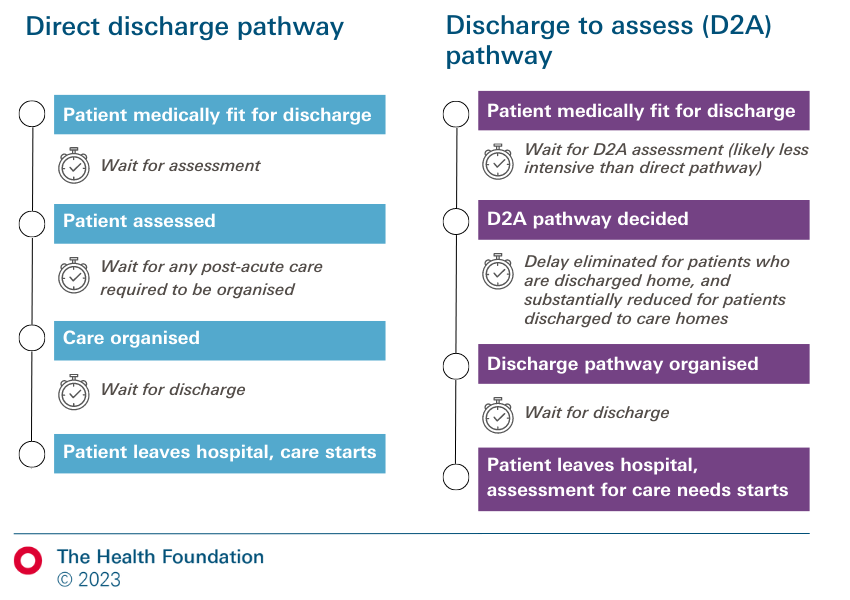
Delays in discharging patients can occur at several points in these pathways.
- Delays in obtaining assessments of post-acute care needs: these may be due to insufficient NHS or social care capacity to coordinate and carry out these assessments. These delays should be reduced under the discharge to assess model. If a patient is discharged to social care, more extensive assessments need to take place.
- Delays in organising and coordinating any care and support needed, or in organising a discharge to assess pathway: these are primarily due to a lack of social care beds or care packages, non-acute NHS beds, or community care packages (eg for rehabilitation). Delays can be further compounded if NHS staff are overstretched. Other factors include disputes over funding for social care (following a needs assessment), patients’ needs for post-discharge care changing during this time, and agreement with the family on the discharge plan.
- Delays in organising discharge itself: this may happen due to limited NHS capacity to prepare discharge papers, medication and medical devices, limited transport availability, or if a service has been secured but will only be available after a certain amount of time.
Delays at each point also cause difficulties to patients and families, including stress related to uncertainty and concern for the patient’s wellbeing, and difficult decisions about loved ones. These delays result from pressures on and capacity in social care and the NHS. We now look at these in turn to understand how each contributes to the increase in delays.
What is driving these increases in discharge delays?
Pressures on social care
Policymakers and the media have often focused on social care as a driver of these increased delays. Pressures on social care services have increased in recent years because of underinvestment and staff shortages. There has been a 3% decrease in filled posts in social care in England since 2020/21 and vacancies have increased by 52% over the same period – now standing at 165,000 vacant posts. These pressures are undoubtedly a significant factor in delays in pre-discharge assessments and in securing placements for patients in need – particularly in London, the east of England and the south east, regions with the greatest unmet need for social care staff.
But available data suggest that waiting for social care services accounts for less than half of discharge delays (Figure 5). The percentage of patients experiencing delays who were waiting for a residential or nursing home placement, or domiciliary care, increased from around a third to just under half during the decade to 2020, but never reached 50%.
Figure 5
Reasons for delays are not directly comparable pre- and post-2020 due to changes in data collection (Table 1). Data from February to December 2022 show that at most 40% of patients staying 1 week or more in hospital and experiencing delays were waiting for a permanent bed in a nursing or residential home, or home care (Figure 6). (Lack of publicly available data prevented us from assessing whether it increased before February 2022.) It is important to note that ‘home care’ includes care provided by the NHS as well as social care, so this percentage is an overestimate of delays due to waiting for social care services. Nonetheless, if social care was singlehandedly driving the rise in delayed discharges, we would expect the percentage of patients waiting for a permanent care home bed or home care to have increased in 2022, alongside discharge delays. Instead, this percentage has decreased since its peak at 40% in February 2022, fluctuating around 37% in September to December 2022. More patients were waiting for short-term rehabilitation (eg in a community hospital) than for a permanent bed in a care home throughout July to December 2022.
Figure 6
Lastly, not all delays among patients waiting for social care services are caused by social care. As well as the reasons for delays, until early 2020 information was collected on which organisation – NHS, social care, or both – was responsible for each delay. Although 45% of delayed patients were waiting for social care services in February 2020, social care was recorded as solely or jointly responsible for only 40% of all delays (the NHS was solely responsible for the remaining 60%). Unfortunately, information on the organisation responsible for delays is no longer collected (since March 2020).
Although social care is a significant contributing factor to delayed discharges, most delays are caused by a combination of other reasons (as was the case pre-COVID).
Pressures on the NHS
Another explanation for recent increases in delayed discharge could be increased pressures on the NHS and its staff, leading to low capacity to perform pre-discharge assessments, set up discharge plans, and coordinate post-discharge care, among other things.
One symptom of these pressures is increased bed occupancy in hospitals. Bed occupancy increased steadily in the decade before COVID-19 (Figure 7a). From its COVID-related dip in mid-2020, it reached 92% among all general and acute beds in the NHS in October–December 2022. Bed occupancy is particularly high for adult general and acute beds, rising from 88% in December 2020 to above 95% in September 2022–January 2023 (Figure 7b).
These bed occupancy levels exceed the maximum threshold of 92% set by the NHS to maintain patient flow this winter, and are far above the 85% threshold recommended by the Royal Colleges of Emergency Medicine and Surgeons. Compared with other countries, the UK has very high levels of hospital bed occupancy. For example, Germany has more than three times the number of beds per inhabitant than the UK, and its bed occupancy was only 68% in 2021. High bed occupancy indicates that wards are functioning at their capacity limit, with high numbers of patients per staff, meaning staff are less able to perform essential assessments and organise post-discharge care for patients needing support. High bed occupancy is known to have adverse effects on patient safety, including higher rates of hospital-acquired infection and inpatient mortality.
High bed occupancy is partly caused by a long-term reduction in the number of hospital beds in England, which decreased by more than 50% between 1987/88 and 2015/16. Although this reduction partly reflects the shift towards more community-based care (eg mental health services) and improvements in productivity (eg increases in day-case surgery), current levels of bed occupancy indicate that bed reduction was implemented without considering changing population needs. Unoccupied beds are essential for helping manage patient flow; too few hospital beds mean wards are vulnerable to spikes in the number of patients admitted. Indeed, delayed discharges would not be in the limelight as an issue of public concern if bed occupancy was at a more manageable level.
Figure 7
Community health and other non-acute NHS services are increasingly stretched too, including from increased use of step-down care as part of discharge efforts, with one in five waiting for short-term rehabilitation (eg in a community hospital) in December 2022.
Lastly, although the total number of hospital admissions is lower than before COVID-19, patients may have more complex needs because of treatment backlogs during the pandemic. This may lead to greater need for complex post-discharge care than pre-pandemic.
Average bed occupancy levels above 92% in hospitals and stretched non-acute NHS services reflect severe pressures on hospitals and community settings. This can delay the provision of patient discharge care – including pre-discharge assessments, communication with family, and coordination with other NHS or social care bodies. Necessary steps often happen one after the other, rather than in parallel, and community services are less able to accept patients, leading to patients with complex discharge needs waiting longer to be discharged.
Conclusion
Social care is often seen as the main cause of delays discharging patients from hospital. Pressures on social care are extreme and many people go without the care they need. But it’s not the whole story: available data suggest that patients waiting for social care services account for less than half of delayed discharges in England. And the considerable pressures on the NHS – including high bed occupancy in hospitals and stretched community services – appear to have contributed to the substantial increase in delays in the last 2 years. These pressures limit capacity to provide timely discharge care, as well as the ability of the NHS and social care services to collaborate smoothly. Factors outside of social care and the NHS may also contribute to delays.
Discharge delays are self-reinforcing: patients kept in hospital longer than necessary are at risk of hospital-acquired infections and increased frailty, which may lead to more complex needs and longer hospital stays. There are also risks to patients if discharge is rushed or premature – including compromising high-quality assessments and patient choice, and avoidable hospital readmissions.
Policies to improve discharge are often short term and focus on the ‘back door’ of hospitals, such as emergency winter funding for social care placements to help patients leave hospital more quickly. There is little published evidence that these short-term funds have made a difference to hospital discharges so far, as the most recent data show there were more than 13,500 patients experiencing delayed discharge in mid-February. But our analysis suggests a broader approach is needed that tackles the mix of causes of delays throughout the system. This includes increasing NHS capacity in hospitals to improve patient flow, identifying and tackling process issues within hospitals that may contribute to delays, and expanding the range of NHS and social care services available to support patients outside hospitals.
The NHS delivery plan for urgent and emergency care services commits to an additional 5,000 staffed hospital beds in 2023/24, and recognises the need to improve joint discharge processes and expand capacity in intermediate care and social care to improve discharge. But the plan includes few new measures and making it happen will be difficult without additional investment and a comprehensive plan for recruiting and retaining staff. The plan also includes no specific measures beyond 2023/24. A longer term approach is needed. REAL Centre analysis suggests that the NHS in England may need an additional 23,000–39,000 hospital beds by 2030/31 to simply deliver 2018/19 rates of care.
Better data are also needed to target action to reduce delayed discharges. As David Nicholson highlights, the quality of SitRep data is doubtful, and efforts should be made to improve it. Publicly available quality-assured data on reasons for delays would enable national policymakers, service planners and managers to make informed decisions to alleviate hospital pressures and allow patients to leave the hospital as soon as they safely can.
Further reading
Work with us
We look for talented and passionate individuals as everyone at the Health Foundation has an important role to play.
View current vacanciesThe Q community
Q is an initiative connecting people with improvement expertise across the UK.
Find out more
