Life expectancy and healthy life expectancy at birth by deprivation
6 January 2022
Key points
- In England, Scotland and Wales, life expectancy and healthy life expectancy at birth are lowest for people living in more deprived areas.
- On average, people in the most deprived 10% of local areas are expected to live a shorter life than those in the least deprived areas. They are also more likely to spend more of their life in poor health.
- Of these three countries, Scotland has the largest difference between people in the most deprived 10% of local areas and those in the least deprived. This is true both for healthy life expectancy (25 years for men and 21.5 years for women) and life expectancy (13.3 years for men and 10 years for women). It is followed by England and then Wales.
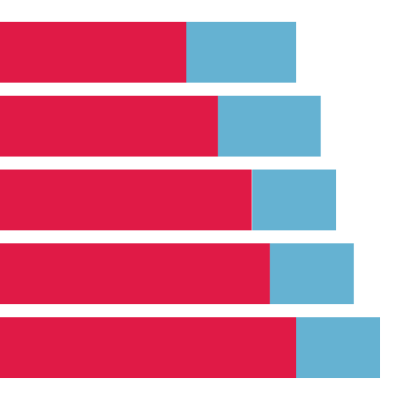
The first chart shows the life expectancy and healthy life expectancy at birth, for males in England, Scotland and Wales, by deprivation. The second chart shows the difference between the least deprived 10% (decile) and all the other deciles, for life expectancy and healthy life expectancy.
Period life expectancy at birth is defined as the number of years that someone could be expected to live after they are born, if current age-specific mortality rates did not change for the rest of their life.
Healthy life expectancy measures the number of years someone is expected to live in good health, based on period life expectancy and a measure of self-rated health.
Deprivation deciles are defined by ranking neighbourhoods by level of deprivation and dividing into 10 equal groups using the Index of Multiple Deprivation (IMD) 2019 rankings.
England
- In England, life expectancy at birth for men living in the most deprived areas is 74.1 years, compared with 83.5 years for men in the least deprived (a difference of 9.4 years). For women, the difference is slightly smaller, at 7.7 years.
- In England, women living in the most deprived areas have a healthy life expectancy at birth of 51.4 years compared with 71.2 years for women living in the least deprived – a difference of 19.7 years. For men, the difference is slightly smaller, at 18.4 years.
Scotland
- In Scotland, female life expectancy at birth in the most deprived areas is 75.6 years, compared with 85.6 years for those in the least deprived. Women born in the least deprived areas not only live 10 years longer on average – they also live 21.5 more years of life in good health.
- In Scotland, male life expectancy at birth in the most deprived areas is 69.5 years, compared with 82.8 years for those in the least deprived. Men born in the least deprived areas not only live 13.3 years longer on average – they also live 25.1 more years of life in good health.
Wales
- In Wales, life expectancy at birth for men living in the most deprived areas is 73.3 years, compared with 82.3 years for men in the least deprived (a difference of 9.0 years). For women, the difference is slightly smaller, at 7.5 years.
- In Wales, women living in the most deprived areas have a healthy life expectancy at birth of 50.1 years compared with 68.4 years for women living in the least deprived – a difference of 18.3 years. For men, the difference is slightly smaller, at 16.9 years.
People living in more deprived areas are expected to live shorter lives than people in less deprived areas. They are also expected to live a smaller proportion of their lives in good health. The government has acknowledged the need to ‘level up health’ and the importance of health to economic prosperity. There is a need for a whole government strategy to improve health and health equity, with a focus on the wider factors – beyond health care and social care – that influence our health.
- There is no UK-wide measure of deprivation, so this analysis uses three different indices of multiple deprivation (IMD): the Scottish Index, the Welsh Index and the English Indices.
- The Scottish IMD, Welsh IMD and English IMD are the official measures of relative deprivation for small areas in Scotland, Wales and England. All three take into account a broad range of social and economic indicators for local areas.
- This chart uses the English IMD 2019 (built from 2011 Lower Layer Super Output Areas known as LSOAs), the Scottish IMD 2020 (built from 2011 data zones) and the Welsh IMD 2019 (built from 2011 LSOAs). The indices rank small areas in each corresponding country from most deprived to least deprived and divides them into 10 equal groups (deciles). Decile 1 represents the most deprived 10% of local areas, while decile 10 represents the least deprived 10%.
- This analysis uses period life expectancy: the number of years that someone born at a given point can be expected to live, if current age-specific mortality rates did not change for the rest of their life.
- Healthy life expectancy measures the number of years an individual is expected to live in good health, based on period life expectancy and a measure of self-rated health.
- In this instance, self-rated health is a measure of health from the Annual Population Survey, adjusted by Census data, on a five-point scale from ‘very good’ to ‘very bad’. Other options include ‘good’, ‘fair’ and ‘bad’. Good health relates to people reporting their health as ‘very good’ or ‘good’.
- Healthy life expectancy data for Northern Ireland are excluded from this chart as they are not available by deprivation decile, due to sampling size and methodological differences in the survey method compared with other UK regions.
Source: Office for National Statistics, Health state life expectancies by national deprivation deciles, England: 2017–2019, Health state life expectancies by national deprivation deciles, Wales: 2017–2019, National Records of Scotland, Life Expectancy in Scotland, 2017–2019