Trends in households without access to a car
1 November 2023
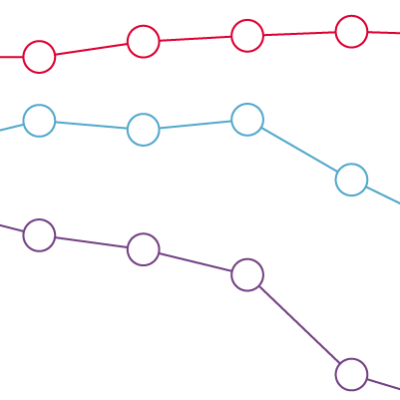
- In 2019/20, 37% of the poorest fifth of households did not have access to a car, compared with just 8.3% of the richest fifth of households.
Transport has a direct effect on health through pollution and noise, but it can also affect health indirectly through its relationship with other factors that shape our health. Not having access to a car can limit social and economic participation and access to public services.
This chart shows the percentage of households in the UK without access to a car by their net household income.
In 2019/20, 21.7% of UK households did not have access to a car. However, this aggregate figure hides large variations depending on people’s incomes.
- More than one-third (37%) of households on the lowest incomes (the bottom quintile) do not have access to a car, which is 4.5 times higher than households on the highest incomes (the top quintile).
- The gap in car-ownership rates between the highest and lowest income quintiles has reduced slightly in recent years, but remains large.
The relatively large upfront and ongoing maintenance costs associated with owning a car partly explain this gap, as these costs are more likely to be a financial burden for low-income households.
An affordable and well-connected public transport system helps to ensure people without access to cars can access job opportunities and public services, which in turn help to support good health.
- The income quintiles are based on equivalised income (adjusted for household size) after tax and benefit income for the household have been taken into account.
Source: Health Foundation analysis of University of Essex - Institute for Social and Economic Research, Understanding Society, UK, 2010–11 to 2019–20.