Relationship between health and residential moves
19 April 2021
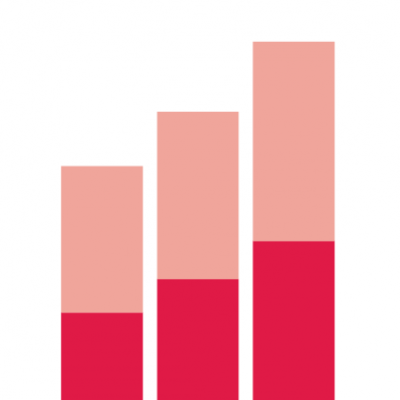
- 14% of parents who did not move between 2000 and 2014 rated their health as less than good, compared to over a quarter (26%) of those who moved three or more times.
This chart is produced using data from the Millennium Cohort Study, which follows a sample of 19,000 children born in 2000 at different points throughout their lives. The chart shows the proportion of the children’s parents rating their health as less than good (poor or fair, rather than good or very good) by the number of times they have moved in the previous 14 years.
The proportion of parents reporting their health to be less than good increases with the number of moves people have made over 14 years, with over a quarter rating their health as fair or poor if they have moved three or more times.
- There is a difference of 10 percentage points between the proportion reporting less than good health if they have moved over three times, in comparison to those that have not moved in this 14-year-period.
- The proportion of people rating their health as poor who have moved three or more times (9%) is over double the proportion for those who have not moved (4%).
More residential moves are associated with poorer health outcomes for both adults and children. One explanation for this relationship is that moving involves interruptions in social, educational and economic opportunities. Moving can also occur as a result of the family experiencing financial difficulties.
Residential moves are higher in social and private rented tenures. The private rented sector is larger than it was 10 years ago, meaning that more families with children may be subject to frequent moves and this could have implications on their future health.
- Moving is captured by a recorded change of address between waves in the Millennium Cohort Study. As households could, in theory, move multiple times between waves, these figures may underestimate the actual number of moves.
Source: UCL Centre for Longitudinal Studies, Millennium Cohort Study, sweep 5