Key points
- Income growth over the 5-year period to 2019/21 was largely weak, and was weakest for the 25% of households with the lowest incomes.
- Growth was more progressive before 2015/17, with higher growth for households on the lowest incomes than households on the highest incomes in the 5-year periods up to 1999/2001 and up to 2014/16.
Inadequate income can be a source of stress, and limits people’s access to goods, services and social participation, which are all necessary for good health.
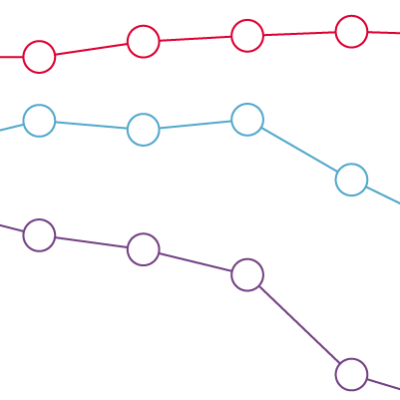
This chart shows the growth in household incomes, measured after housing costs and equivalised to take account of household size, grouped by percentiles between the lowest and highest incomes. Growth is shown over different 5-year periods.
The UK’s income growth in the last few decades can be summarised into four distinct periods.
- 1999–01 to 2004–06: People at all levels of income shared strong growth. It was strongest at around the 15th percentile, so was largely progressive.
- 2004–06 to 2009–11: the growth in income for people in the bottom 10% of the income distribution was higher than the median. This reflected a combination of factors, including recovery from the early 1990s recession, growing employment rates and social security changes.
- 2009–11 to 2014–16: income growth stagnated until the recession in 2009, after which there were declines in real income for people at all levels of income.
- 2014–16 to 2019–21: rising employment has led to economic recovery except for people whose incomes are below the 25th percentile. This recovery is modest relative to the growth in the late 1990s and early 2000s – and has not been shared by people on the lowest incomes.
Changes in people’s real incomes give an insight into the financial pressures affecting households. If someone’s income struggles to keep pace with rising costs, this piles financial pressure on them, and the stress has an impact on their health. These patterns are not inevitable: policies that have reduced the value of social security benefits for working-age families have resulted in worse growth for poorer families in the last decade.
- Figures are expressed as total growth over each of the 5-year periods identified in the chart. Income estimates take into account inflation and are expressed in constant CPI price terms.
- Income is adjusted for household size to reflect economies of scale.For example, a household of four needs more income for the same standard of living as a household of one, but not four times as much.
- Housing costs are deducted from income, to reflect that people with lower incomes in particular have fewer options for meeting their housing costs, relative to their income.
Source: Department for Work and Pensions, Households Below Average Income 2021