
Indicator
Map of life expectancy at birth by constituency
Published
14 January 2025
Last updated
17 February 2025
Time to read
 About 2 mins
About 2 mins
Key points
- People born in Winchester, the constituency with the highest life expectancy, have a life expectancy at birth of 85.3 years, whereas people born in Glasgow North East, the constituency with the lowest life expectancy, have a life expectancy of 74.2 years – a difference of 11.1 years.
- On average, constituencies in London and the South East have the highest life expectancy at birth (82 years). Constituencies in Scotland have the lowest average life expectancy at birth (79 years).
- There are large inequalities between neighbouring constituencies across the UK.
There is a gap in life expectancy of 11 years between constituencies
People’s life expectancy – a summary measure of years of life based on mortality in a given year – varies across different geographical areas within a country. This captures socio-economic inequalities, as differences between places tend to reflect socio-economic characteristics of places (including available amenities and jobs) and populations (such as education and income levels).
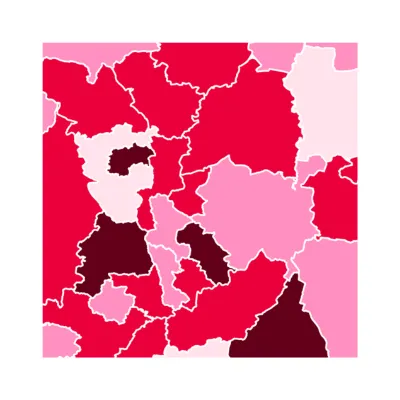
This map shows period life expectancy at birth for each parliamentary constituency in the UK in 2022.
- There is a gap in life expectancy at birth of 11.1 years between constituencies.
- The constituency with the highest life expectancy at birth is Winchester (85.3 years), followed by Richmond Park (84.6 years), and Cities of London and Westminster (84.6 years).
- The constituency with the lowest life expectancy at birth is Glasgow North East (74.2 years), followed by Liverpool Riverside (75.0 years) and Glasgow East (75.5 years).
- On average, constituencies in London and the South East have the highest life expectancy at birth (82 years). Constituencies in Scotland have the lowest average life expectancy at birth (79 years).
- There are also large inequalities between neighbouring constituencies. For example, while Glasgow North East has the lowest life expectancy (74.2 years), neighbouring constituency Mid Dunbartonshire has a life expectancy of 82.6 years, a difference of 8.4 years.
- Similarly, within London there is a difference of 5.2 years between constituencies with the highest and lowest life expectancy. While constituencies such as Kensington and Bayswater, and Hampstead and Highgate, have life expectancies over 84 years, nearby constituencies, such as Bethnal Green and Stepney, and Hackney South and Shoreditch, have life expectancies of just 79 years.
- Life expectancy refers to period life expectancy at birth – calculated using age-specific mortality rates of a given area and point in time and assuming these will stay the same throughout a person’s life.
Source: Health Foundation analysis of Office for National Statistics, Life expectancy at birth for Parliamentary Constituencies in the UK, 2022








