What geographic inequalities in COVID-19 mortality rates and health can tell us about levelling up
17 July 2021
Key points
- COVID-19 mortality rates for people younger than 65 were 3.7 times higher in the most deprived areas than the least deprived areas in England between March 2020 and March 2021.
- COVID-19 mortality rates for people younger than 65 varied considerably across England, and during the second wave of the pandemic were highest in London (25.5 COVID-19 deaths per 100,000), the North West (22.0) and the West Midlands (21.7) in contrast to 6.4 per 100,000 in the South West.
- The local areas with the highest COVID-19 mortality rates for people younger than 65 tended to have lower life expectancy, lower employment rates, and more overcrowded housing, deprivation and child poverty than the England average.
- The inequalities in COVID-19 mortality rates for people younger than 65 partly reflect higher levels of infection in deprived areas, as well as worse underlying health.
- Areas where the Conservative Party held seats in the 2019 General Election (which are more likely to be rural and affluent) experienced 13.7 COVID-19 deaths per 100,000 people younger than 65. Seats that the Conservatives gained in 2019 – many of which are the so-called ‘red wall’ areas – had a considerably higher COVID-19 mortality rate for this age bracket, of 20.7. The highest mortality rates were in seats held by Labour (predominantly in London and urban areas).
- Underlying poor health across the country also poses a risk to the economic objectives of the ‘levelling up’ agenda. In 15% of council areas in Great Britain, over a fifth of the working-age population have a work-limiting health condition or impairment. The employment rate for people with a work-limiting condition is 47%, compared with 81% for people without. In areas where lots of people have a work-limiting condition, new employment opportunities need to be made as accessible as possible to maximise uptake.
- The government’s levelling up agenda (and any associated targets or metrics) must address the underlying health and economic challenges that have contributed to some areas experiencing more COVID-19 deaths than others.
It is well known that existing inequalities have been exacerbated by the COVID-19 pandemic. What is less well known is that some of these inequalities are even starker among the younger (working age) population. This was covered in the Health Foundation’s COVID-19 impact inquiry, and here we explore the topic in more detail.
The ‘deprivation gap’ in COVID-19 mortality is wider for people younger than 65
One of the key findings of the impact inquiry is that the inequality in COVID-19 mortality between areas with different levels of deprivation is greater for people younger than 65 than for those aged 65 and older. The inequalities in underlying health and the socioeconomic conditions associated with exposure become clearer when considering this younger age group in isolation.
Figure 1 shows that COVID-19 mortality in the most deprived tenth is nearly four times higher than in the least deprived tenth among people younger than 65, compared with twice as high for those aged 65 or older. It is however important to note that between March 2020 and March 2021, there were significantly fewer COVID-19 deaths among people younger than 65 than among those aged 65 or older (13,700 compared with 108,900 deaths).
Figure 1
This ‘deprivation gap’ reflects multiple factors, including higher risk of exposure to the virus and the underlying susceptibility of the population due to poorer health. The COVID-19 impact inquiry lays bare the social gradients of COVID-19 exposure – including less opportunity to work from home during the pandemic, more overcrowded housing and financial difficulties in self-isolating. Another key factor is underlying health conditions, which can increase the severity of COVID-19 outcomes. This poorer health is in turn partly due to the generally worse social and economic conditions in these more deprived areas.
These factors combine, in ways that are difficult to perfectly untangle, to produce marked differences in COVID-19 mortality rates across society.
COVID-19 mortality rates for people younger than 65 were higher in the second wave than the first wave
Figure 2 shows the changing picture in mortality rates between the two waves of the pandemic by region in England. In the second wave, COVID-19 mortality rates were higher in all regions and there was less of a difference between London and other regions. This suggests that the national lockdown in January 2021 occurred after the virus had spread further across other parts of the UK than it had prior to the lockdown at the beginning of the first wave.
London, the North West and the West Midlands had the highest COVID-19 mortality rates for people younger than 65 in both waves, with London in the second wave having 25.5 deaths per 100,000 people younger than 65. The South West had the lowest COVID-19 mortality rates in both waves. In the first wave, excess mortality was around 5,700 higher than COVID-19 mortality, suggesting that the number of deaths shown in Figure 2 for the second wave may be undercounts of the true mortality burden.
Figure 2
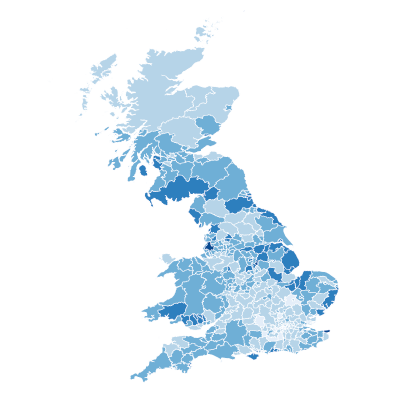
In the second wave, COVID-19 mortality rates for people younger than 65 were highest in urban areas
COVID-19 mortality for people younger than 65 varied significantly between local areas. Figure 3 shows COVID-19 mortality rates for people younger than 65 by local authority. This highlights differences in the experience of COVID-19 in more urban regions compared with rural areas. There were particularly high COVID-19 mortality rates for people younger than 65 in London and some authorities in the South East (including Slough and Bedford), the Valleys in south Wales as well as in Greater Manchester and Birmingham.
Figure 3
What do the areas that experienced the worst COVID-19 mortality rates for people younger than 65 have in common?
Figure 4 provides further detail about the characteristics of the 25 areas with the highest mortality rates in the second wave of the pandemic. Predominantly, but not exclusively, people living in these areas have worse underlying health (as measured by male life expectancy at birth), as well as experiencing more overcrowded housing, lower employment rates and higher child poverty rates. All but three of these places are in the most deprived half of local authority areas in England, and none are in the least deprived 40% of areas.
The COVID-19 impact inquiry found that overcrowding and worse underlying health (as measured by life expectancy here) were associated with increased exposure to, and worse outcomes from, COVID-19. But more broadly, these shared characteristics show that areas that were struggling economically tended to be hit hardest by COVID-19. And that even before the pandemic, these poorer economic conditions had contributed to worse underlying health for people living in these areas.
Figure 4
Levelling up the economy will depend on levelling up health
Regional differences such as those set out above are on the government’s ‘levelling up’ policy agenda. But the levelling up funding and policies laid out so far are incomplete, and measures of health are not yet influencing the initial allocation criteria for levelling up funds. The impact of any levelling up funding will also face the challenge of undoing over a decade of local government austerity, which has been associated with decreasing life expectancy. Action to improve health and reduce inequalities should be a core component of the government’s levelling up approach.
COVID-19 mortality rates for people younger than 65 – and the characteristics of the places where this was highest – provide an indication of the areas that should be a major focus of the government’s levelling up approach, if it is to meet the commitment to ‘level up health’ set out in the Queen's Speech.
First, poor health and poor economic performance go hand-in-hand, and improving either will require improving the other. Figure 5 looks at the percentage of the working age population in Great Britain who have a work-limiting impairment or condition. The employment rate for people with a work-limiting condition is 47%, compared with 81% for people without. In areas where a greater proportion of people have work-limiting conditions, new employment opportunities should be made as accessible as possible to maximise uptake and economic progress.
Figure 5
Second, political geography matters in levelling up. Figure 6 shows how COVID-19 mortality rates for people younger than 65 relate to parliamentary constituencies.
Figure 6
Areas where the Conservative Party held seats in the 2019 General Election (which are more likely to be rural and affluent) experienced 13.7 COVID-19 deaths per 100,000 people aged younger than 65. Seats that the Conservatives gained in 2019 (which tend to have older populations and are often more deprived towns in the Midlands and the North of England) – many of which are the so-called ‘red wall’ areas – had considerably higher COVID-19 mortality rates for this age bracket, of 20.7 deaths per 100,000. The highest mortality rates were in seats held by Labour (predominantly in London and other urban areas), with 24.6 COVID-19 deaths per 100,000 people younger than 65.
Conclusion
If levelling up is to succeed in increasing prosperity and widening opportunity across all parts of the UK, the longstanding pre-pandemic health and economic problems that contributed to some local areas experiencing higher rates of COVID-19 mortality must be addressed. As the government develops its strategy for levelling up, there needs to be an explicit goal to level up healthy life expectancy. Figure 7 shows firstly how life expectancy in each area of the UK compares to the UK’s historical average, and secondly how this relates to areas deemed ‘priority 1’ in the Levelling Up Fund. The chart shows that in 2016–18, 169 local authorities had female life expectancy at birth below the 2016–18 average, and of those 17 had life expectancy that was still below the average in 2001–03. Of the 123 local areas in priority group 1, 24 had life expectancy above the 2016–18 average.
Figure 7
There are clear gaps, with some of the areas which are furthest behind on life expectancy not yet prioritised by the government for levelling up. To ensure equitable progress, a broader set of metrics should be used to target funding and assess progress, with short and longer term measures of health and wellbeing taken into account. Only then can levelling up truly address the underlying health and economic challenges that led to certain areas experiencing more COVID-19 deaths than others.
Further reading
Work with us
We look for talented and passionate individuals as everyone at the Health Foundation has an important role to play.
View current vacanciesThe Q community
Q is an initiative connecting people with improvement expertise across the UK.
Find out more
