Proportion of adults who cycle or walk, and how often, in each English local authority
 About 2 mins
Key points
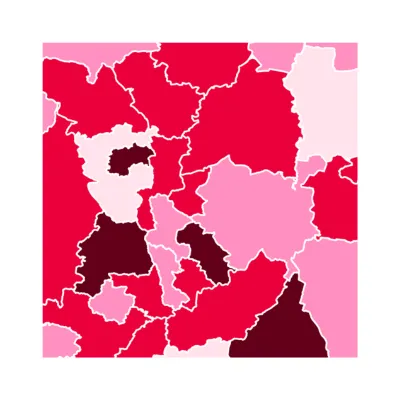
- The share of adults walking at least five times per week varies – from 48% in the Isles of Scilly to 20% in Sandwell.
- The share of adults who cycle at least once per month varies from 54% in Cambridge to 6% in Gateshead.
Increasing physical activity and minimising the time we spend sitting down helps to maintain a healthy weight and reduces the risk of cardiovascular disease, type 2 diabetes, cancer and depression. The NHS recommends that adults should do at least 150 minutes of moderate activity, or 75 minutes of vigorous activity, each week.
This chart shows the share of adults who walk and cycle (also known as active transport) for any purpose, and how often, in each English local authority.
On average, relatively few people in England regularly walk and cycle. In 2023:
- 14.7% of adults cycled once per month, but only 2.5% cycled five times per week or more.
- 76.5% of adults walked once per month, but only 43.4% walked three times per week. A total of 31.8% of adults walked five times per week or more.
Regular walking or cycling rates vary significantly in different parts of the country.
- The share of adults cycling at least once a month was highest in Cambridge (53.9%), the Isles of Scilly (41.4%) and Oxford (39.7%). The proportion was as low as 5.6% in Gateshead, and 6.2% in Havering.
- The share of adults walking at least five times per week was highest in the Isles of Scilly (48.1%), followed by Oxford (45.6%) and Plymouth (44.3%), and lowest in Sandwell (20.2%) and Kirklees (20.8%).
To a certain degree, these differences in active travel may reflect a difference in the population age structure and urban density. However, some areas, such as Cambridge, have introduced policies to boost active transport use, including dedicated cycling lanes, speed limits and increased car parking charges.
- The figures are based on area of residence rather than where people walk or cycle.
- The data includes all cycling and any walking over 50 yards.
Source: Department for Transport, Walking and cycling statistics, England, 2023