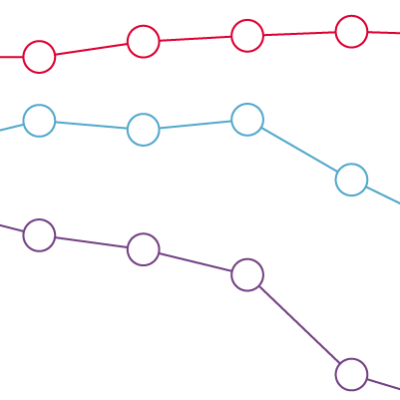
- Since 2015, bus fares have increased by 59%, compared with increases of between 15% and 36% for other transport costs captured by the Consumer Price Index (CPI) and 27% for overall CPI inflation.
Transport can affect health both directly and indirectly, through its relationship with the wider determinants of health. An affordable public transport system can encourage active transport – with people walking and cycling more to access the transport services – and can also support social and economic participation and access to public services. But higher transport costs can create a financial strain, limiting resources to spend on other goods and services that support good health.
This chart shows the percentage change in cost since 2015 of public transport fares (railway, bus and coach, and underground and tram) and private motoring (purchase of vehicle and operation of transport equipment) and the overall basket of goods and services captured by the Consumer Price Index (CPI).
Prices in the overall CPI increased by 27% between January 2015 and January 2023, but the increase in transport costs varies according to the type of transport:
- In January 2023, bus fares in the UK were 59% higher than in January 2015. This was also a 9 percentage point increase in fares in the past year since January 2022.
- The increase in fares for other forms of public transport has been comparatively lower since January 2015: 27% for trains, in line with overall CPI, and 15% for underground and trams – significantly below overall inflation.
- Private transport costs also increased. The purchase of a vehicle increased by 25% and the costs of operating a personal vehicle increased by 36%.
Increased funding can help to increase the number of bus routes and frequency of service, and reduce fares, making buses more affordable. This helps to connect people to job opportunities and services. Complementary policies that support bus use, such as lane prioritisation, can also help.
The Consumer Price Index’s transport component (CPI Index 07) can be divided up into the following sub-components presented here:
- purchase of vehicles (CPI Index 07.1)
- operation of personal transport equipment (CPI Index 07.2), which includes spare parts and accessories, fuel and lubricants, maintenance and repairs, and other services. It does not include insurance or the actual purchase of the vehicle
- passenger transport by train (CPI Index 07.3.1.1)
- passenger transport by underground and tram (CPI Index 07.3.1.2)
- passenger transport by bus and coach (CPI Index 07.3.2.1).
Source: Health Foundation analysis of Office for National Statistics, Consumer price inflation time series, 2015 to 2023.


