
Mortgage and landlord repossessions across English local authorities
 About 2 mins
Key points
- 11 of the 15 areas with the highest rates per 1,000 households of landlord and mortgage repossessions in 2023/24 (Q2) were in London.
- There were 28,250 repossessions in England in 2023/24 (Q2). Newham had the highest number at 578, as well as the second-highest repossession rate per 1,000 households (4.8 per 1,000 households).
- Slough had the highest rate of repossessions in the country (5.0 per 1,000 households).
Insecure housing poses a risk to health, as it can undermine people’s sense of control over their environment and cause stress. Research has found that accumulating housing cost arrears, and facing imminent eviction and/or repossession can have a considerable impact on someone’s psychological wellbeing.
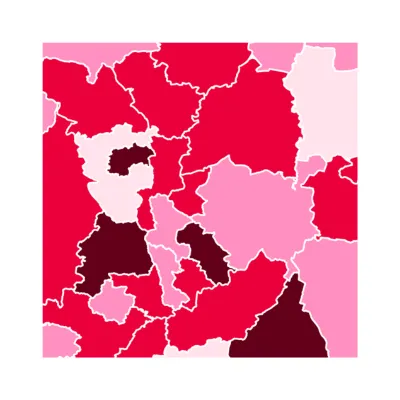
This map shows the number of mortgage repossessions (homeowners) and evictions (private and social renters) per 1,000 households in English local authorities in the four quarters to 2024 Q2.
- Slough, Newham, Luton, Lewisham, Enfield and Hastings had the highest rates of repossession in 2023/24 (Q2). In Slough there were 5.0 repossessions for every 1,000 households and this rate was closely followed by Newham, where the rate was 4.8 repossessions per 1,000 households.
- The lowest rates of repossessions were in Thurrock, Derbyshire Dales and Basildon (0.1 repossessions per 1,000 households) and South Cambridgeshire, South Hams, West Devon, Fareham, Mid Suffolk, Mole Valley, Bromsgrove and the City of London (0.2 per 1,000 households).
Areas in London and South East England with typically higher housing costs may have higher rates of repossession, as people find it harder to meet mortgage and rent payments.
There were around 3,600 more repossessions in the year to June 2024, compared with the same period in 2023. This likely reflects the relaxation of the COVID-19 eviction laws, rising rents and the cost-of-living crisis, which has led to wider financial pressures.
- Only repossessions carried out by county court bailiffs are included in these figures. Repossessions may also take place through less formal procedures, in which case they would not be counted in these figures.
- Possession claim counts used here represent the sum of claims over four quarters to Q2 of the stated year.
- The repossession data are based on the address of the defendant (the person whose home is being repossessed). This means that in some mortgage repossession cases, where defendants have a second home or a buy-to-let mortgage in a different local authority to their current address, counts do not necessarily reflect local repossessions accurately.
- The number of households originates from the Office for National Statistics 2018-based household population projections.
Source: Ministry of Justice, Mortgage and Landlord Possession Statistics, England, 2024 Q2; Office for National Statistics, Household projections for England 2018-based, 2020








