
Households that are homeless or at risk of homelessness, by local authority
 About 2 mins
Key points
- The rate of households owed a homelessness prevention or relief duty is higher in London and urban areas.
- Areas in the Midlands have some of the lowest rates of households owed a homelessness prevention or relief duty.
- In Islington, the rate of households owed a homelessness prevention or relief duty is 8.2 per 1,000 households, which is the highest in England.
Becoming homeless and living in temporary accommodation is an extremely stressful experience, linked to both mental and physical health problems. The experience of homelessness harms mental health, and shelter (when available) may be overcrowded and poor quality, which can also harm health directly.
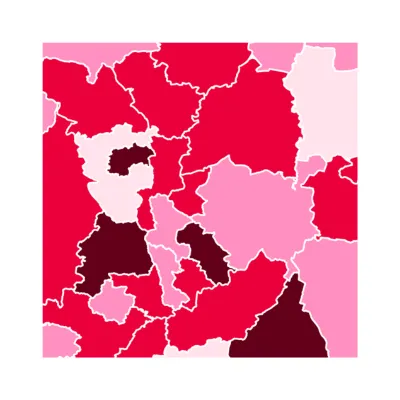
This chart shows the rate of households owed a homelessness prevention or relief duty on initial assessment in each local authority from April to June 2024 in England. Prevention and relief duties are legal obligations placed on local authorities to secure accommodation for people who qualify as homeless (relief duty) or to take reasonable steps to prevent homelessness for people who are threatened with losing their home within 56 days (prevention duty).
The rate of households owed a homelessness prevention or relief duty is higher in urban areas, particularly in London, but some rural areas also have a high rate, such as North Devon (4.5 per 1,000 households).
- All of the 20 local authorities with the highest rates of households owed a prevention or relief duty are in predominantly urban local authorities.
- 13 of the 20 local authorities with the lowest rates are in local authorities that are either predominantly rural or have significantly large rural areas.
- 8 of the 20 local authorities with the highest rates of households owed a homelessness prevention or relief duty are in London.
- 9 out of the 20 local authorities with the lowest rates are in the Midlands.
- The rate is highest in Islington (8.2 per 1,000 households), Portsmouth and Halton (both 7.9 per 1,000 households), and Blackpool (7.7 per 1,000 households).
- Conversely, the rate is less than 1 per 1,000 households in Ribble Valley, Broxtowe, Cannock Chase, South Staffordshire and Stafford.
- On initial assessment by a local authority, a prevention duty is owed if someone is threatened with homelessness within 56 days. If a person is already homeless, they will be owed relief duty.
- The local authority must take reasonable steps to prevent someone from becoming homeless or help people who are already homeless to secure suitable accommodation. This can involve helping a person to stay in their current accommodation or finding them a new place to live.
- The data in this analysis cover duties owed on initial assessment only. If homelessness is not resolved after the relief duty, an individual may be owed a main housing duty. People owed a main housing duty are not covered here.
- Brent, Camden, Canterbury, Croydon, Epping Forest, Maldon and Redditch did not provide data for this quarter and are not included.
- Areas are classified as rural or urban using the Office for National Statistics Rural/Urban classification for Local Authorities.
Source: Ministry of Housing, Communities and Local Government, Live tables on Homelessness, England, April to June 2024








