
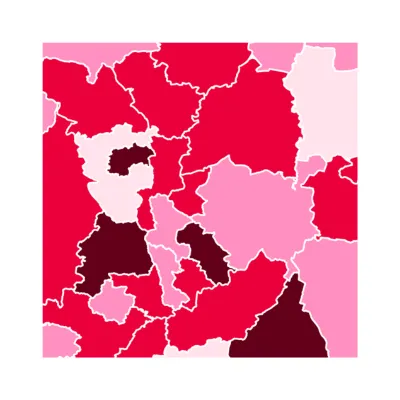
Proportion of properties built before 1919 by local authority
 About 2 mins
Key points
- 15% of all homes in England are classed as non-decent, which is equivalent to 3.7 million properties.
- The older the property, the more likely it is to be non-decent. Almost one-third of homes built before 1919 are non-decent.
- Older properties are more common in areas of London and Wales.
Poor housing conditions can have a direct effect on people’s health. For example, damp in the home can affect respiratory health.
The map shows the proportion of homes built before 1919 in each local authority in England and Wales in 2024. This measure is being used as a proxy to give an indication of where non-decent homes are most common, as a third of properties built before 1919 are non-decent, compared with only 5.1% of properties built after 1980.
- In the 10 local authorities with the highest proportion of older properties, over 46% were built before 1919. Five of these local authorities are in London and three are in Wales.
- In Kensington and Chelsea, two-thirds (65.1%) of all properties were built before 1919, which is the highest proportion in England and Wales. This is followed by Hammersmith and Fulham (56.0%), Haringey (54.3%) and Pendle in Lancashire (52.1%).
- In 13 local authorities, the proportion of properties built before 1919 is below 5%. The local authorities with the lowest proportion of these older properties are Basildon (1.0%) and Harlow (1.4%).
The UK has the oldest housing stock in Europe, and Wales has the oldest housing stock in the UK. This is largely due to the legacy of homes built during the industrial revolution, which continues to provide the foundation of urban areas today.
There are limitations to using this proxy measure as it is not exact: there will be some older properties that are decent and some newer properties that are non-decent. It can also reflect the nature of the area, such as inner-city areas with little scope for new buildings or that contain expensive period properties that only wealthy people can afford.
- Non-decent homes are defined as those with a Category 1 hazard – as assessed by the Housing Health and Safety Rating System (HHSRS) – that are not in a reasonable state of repair, lack reasonably modern facilities or are not warm enough (do not provide a reasonable degree of thermal comfort).
- ‘Unknown’ records, equating to 0.8% of properties, are those where there is no record of when the property was built.
Source: Valuation Office Agency, Table CTSOP4.0: Number of properties by Council Tax band, property build period and administrative area, England and Wales, 2024








